


Tools in ZIMS Husbandry Index
Using the various Tools found in the ZIMS Husbandry module
The Tools in ZIMS are found under Start > Tools. Some of these Tools help you interpret and compare your data and some help save you time and provide consistency. Most of these look only at your data and records though some, such as Pedigree Explorer and Taxonomic Inconsistency will also look at global data.
Tools Covered
|
Measurement Range Template s (including Target |
|
|
Weight Range) |
|
|
(Enclosure, Life Support, Components) |
|
Pedigree Explorer
Viewing Parents, Descendants and Siblings for a specified animal in ZIMS.
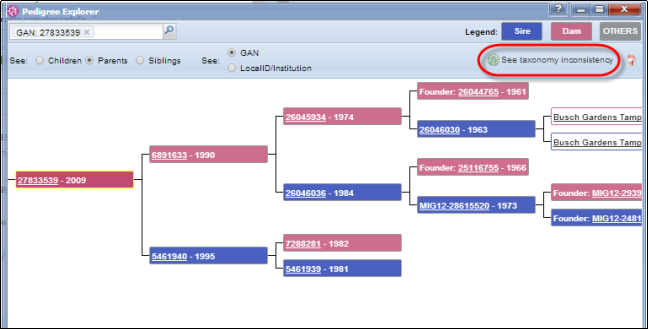
The window below will open. You can search for an animal by the standard identifiers (GAN, Local ID, Preferred ID, other common identifiers). Below we have selected to view Parents, which is the default selection. The animal in focus appears on the far left.
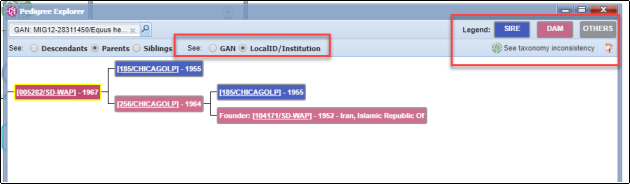
You can select to see the GAN or the Local ID for the animals displayed. Above we selected Local ID. Notice the Legend at the top right of the page to color code who is who. You can also search for any Taxonomy Inconsistency (see
Taxonomic Inconsistency
) and export the pedigree to Excel.
On a different animal, we selected to view Siblings and to see the GAN instead of the Local ID.
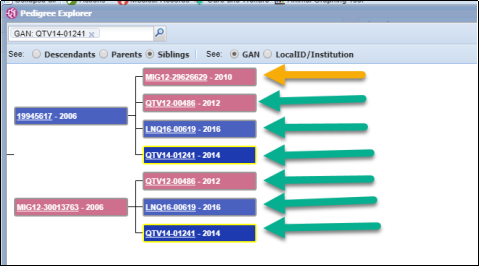
The Sire and Dam of the animal in focus are on the far left. The green arrows indicate full siblings as both Sire and Dam are the same. The yellow arrow is a half sibling as only the Sire is the same.
Below we selected to view Descendants of another animal.
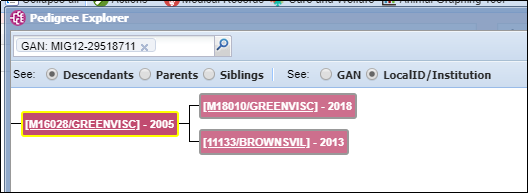
The animal in focus is on the far left. She produced two female offspring, one is at GREENVISC and one is at BROWNSVIL.
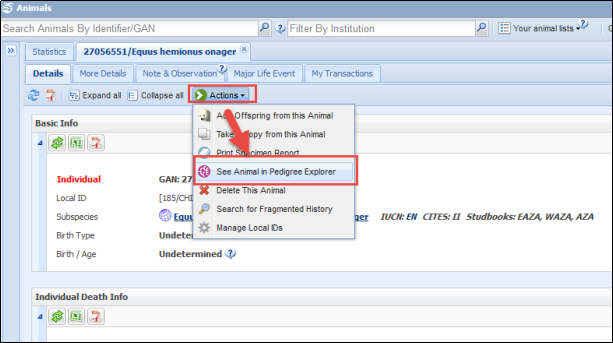
The report can also be run while looking at an individual’s record under the Detail’s tab. You will not need to search for the record using this approach.
Back to Tools Covered
Group Explorer
How to visually navigate the history of your Groups in ZIMS.
You can search for the Group by GAN or Local ID, or use the magnifying glass lookup to help you find it.
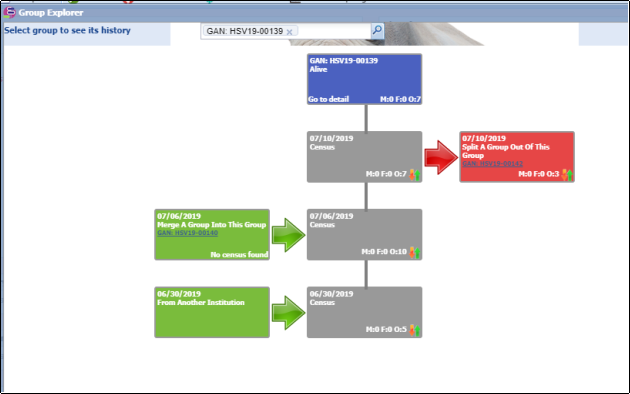
All the additions to the group are displayed on the left. Any removals from the group are displayed on the right. Census counts are shown in the middle, with the most recent count at the top. Merges and Split are hyperlinks into the Group record involved.
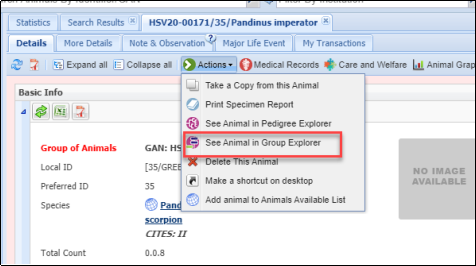
You can also navigate to Group Explorer from within a Group record from Details tab > Actions > See Animal in Group Explorer. You will not need to search for the Group using this approach.
Back to Tools Covered
Manage Test Panels
Test Panels make test and result entries for a specified lab quicker and easier. Although these can be managed from the Husbandry module they are used in the Medical module. In Tests and Results in ZIMS for Medical, you can provide a list of known laboratory panels that are to be used for a specific sample type .
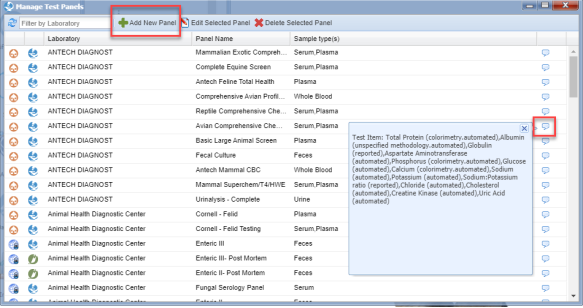
In addition to managing the panels from the Tools menu in the Husbandry module, Test Panels can be managed from the Test and Results data entry screen from the Manage Favorite Test Panel icon:

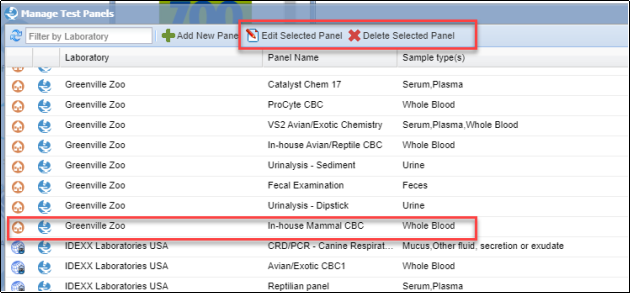
The Test Panel management screen will open. Any Species360 Global Test Panels will pre-load and have the globe icon. Any Test Panels that you have created will have the local house icon. The type of panel (clinical or pathology) will display to the right of the scope icon. You can create new Test Panels by selecting Add New Panel. Hovering over the note will display what tests are included.
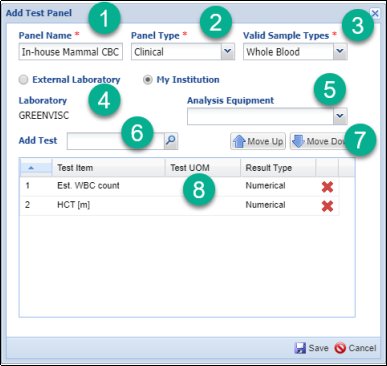
1.The Panel Name must be unique within your facility.
2.The Panel Type is Clinical or Pathology
3.The Valid Sample Type is a multiple select dropdown that allows you to select more than one type.
4.You can select an External Laboratory or My Institution. The External Laboratory is sourced from the global and local institution list of Laboratories. If it cannot be found you will need to add it as a Local Institution > Category = Other and Type = Laboratory. What you select here (External Laboratory or My Institution) must match the selection you make when you request a test or the Test Panel will not display in the list of available panels to select from.
5. The Analysis Equipment is a single select cascading drop down list.
6.Add Test is a type ahead lookup that will display possible matches as you type, or you can use the magnifying glass lookup to help you find the Test desired.
7. Arrange the tests in the order that you will want to record the data by using the Move Up and Move Down arrows above the list.
8. Add the "Test UOM" preference for each by double left clicking in the 'white space' between Test Item and Result Type column.
Once saved, the Panel will display in the Manage Test Panels list. To edit or delete any Local Test Panels use the buttons at the top of the list. You cannot edit or delete any Species360 Global Test Panels.
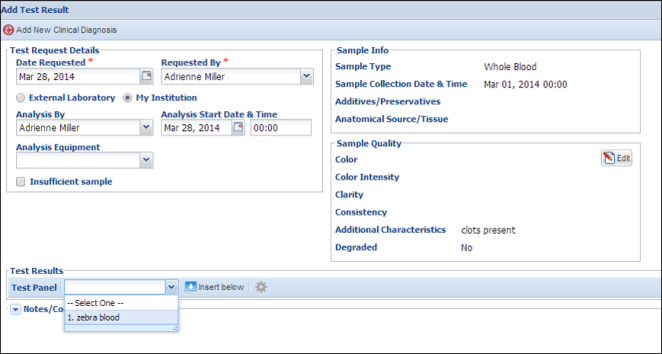
To use the Test Panel, select the appropriate Sample and request a test on it. For more details on Samples see Samples . For more details on Tests and Results see Tests and Results . Complete the mandatory and optional fields as desired in the Test Request Details. Select the desired Test Panel from the dropdown. Then select Insert Below.
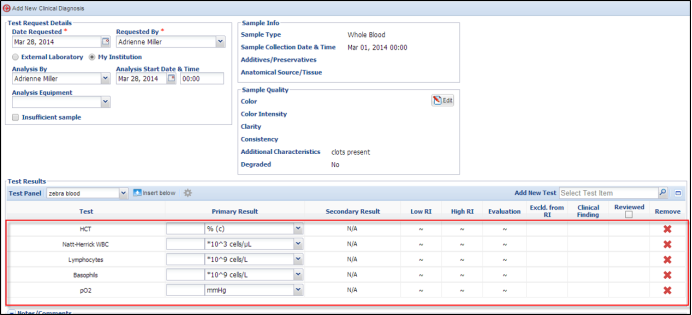
The tests you have recorded for your Panel will display in the order that you arranged them in the Test Panel you created.
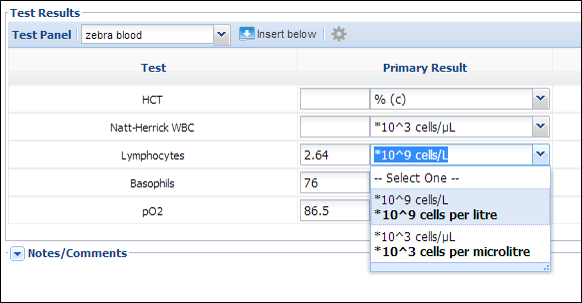
Now record the test results. If the default Unit of Measure is not what you desire it to be you can use the dropdown selections to select the appropriate unit.
Back to Tools Covered
Manage Templates
The Manage Templates Tool allows you to manage several types of Templates in one place. Click the link for the desired Template to view the associated Help document. For these Tools you will need Role access to “Mixed Records Templates” in the Local Reports & Tools section.
- Aquarist Daily Log - Aquarist Daily Log
- Animal Measurements – Animal Measurements
- Husbandry Log Template - Husbandry Log Template
- Enclosure/Life Support/Component Measurements - Measurement Template
Comparison of functionalities available in the Environmental Measurement, Aquarist Daily and Husbandry Log Template:
|
H20 Quality Log |
Aquarist Daily Log |
Husbandry Log |
|
Water Quality measurements only Tab through to next box for fast entry (skips UOM)
UOM are preset with default
UOM are allowed to change when entering data.
Sort in specific order
Apply to all Sub-enclosures
Additional info-Notes: Click to open text box
Save or Save and Repeat
Shareable
View data saved in within enclosure record
No checklist items
One page
Tab function-skips UOM |
Enclosure, Water Quality, Life Support, Component Data (enclosure feed log, notes, maintenance, measurements)
UOM are preset with default
UOM are allowed to change when entering data.
Sort in specific order
Apply to all Sub-enclosures
Additional info-Notes: Click to open text box
Save or Save and Repeat
Shareable
View data saved within enclosure/life support or component record
No checklist items
One page
Tab function-skips UOM |
Animal, Enclosure, Life Support and Component Data (feed log, notes, maintenance, measurements, training, enrichment, weights, etc)
UOM: option to lock setting
UOM: locked unable to change UOM: unlocked: able to change
Sort in specific order
Apply to all sub-enclosures: only for
Apply to all occupants: only for feed log and enclosure notes/observations
On/Off setting for specific data (keywords, details, etc)
Save Sheet or Save All OR Save Draft Add Rows for backlogging needs
Shareable
View previous data entries (last 5 entries) within template
Add checklist items
Sheets/Tabs
Tab function (opens note box) |
Back to Tools Covered
Manage Note Template
How to create and update the Note Templates Used in ZIMS
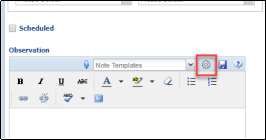
In addition to getting to this Template from the Start menu, you can also get to this screen by selecting the wheel icon from a Note or Observation add or edit screen.
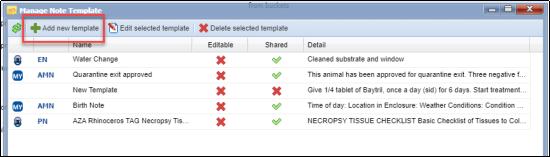
To add a New Note Template select Add New Template at the top of the screen.
We are creating a Note Template to capture information regarding the death of an animal found dead in an enclosure.
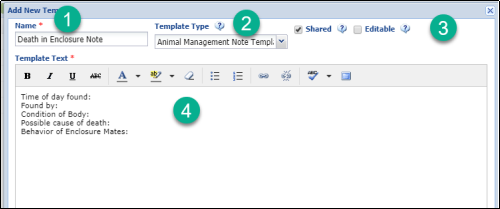
1) The Name must be unique, name it so it is easy to find when needed. The Name can be edited but you may want to develop a naming convention
2) Select the Template Type (example Animal Management Note, Clinical Note, Enclosure Note) as the Template will be available to select only from within that Note type.
3) Check if you want to share the Template or have others able to edit it.
4) Record the text you want in the Template and Save.
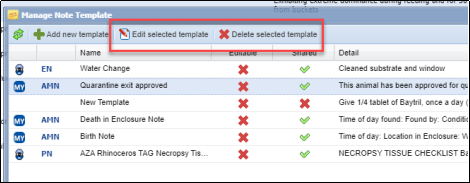
Your Template will now appear in the list.
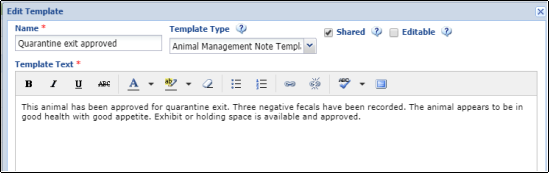
The Template above was created to help the recorder remember to capture all the information needed for this type of death. Another type of Template can already contain the verbiage desired so no additional data needs to be entered as illustrated by the Quarantine Exit Template below:
Once your template is in the list, if you highlight it, you can Edit or Delete it. If you Edit it, there will be no changes to previously entered data using the Template. If you delete it, all information previously recorded using it will remain as recorded.
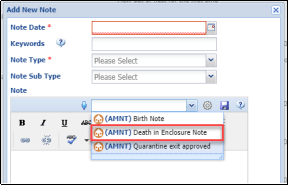
Your Template will now display in the drop down list to select when you are in the appropriate type of Note, in our case an Animal Management Note.
Back to Tools Covered
Taxonomic Inconsistency
This Tool allows you to check for any taxonomic inconsistencies in the pedigree of an animal.
In addition to getting to this Tool via Start > Tools, you can click the See Taxonomy Inconsistency button via any pedigree explorer screen.
If getting to the Tool from the Start menu you will need to enter the desired animal. If getting to it from Pedigree Explorer, the animal will prefill.
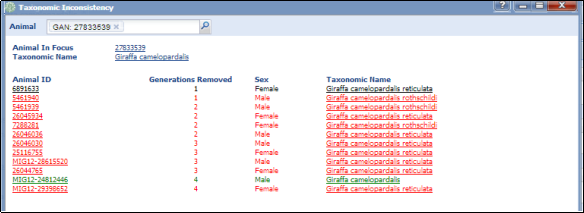
In the record above you can see that two different subspecies have been recorded for the ancestors. The animal in focus is correctly recorded at the species level due to these inconsistencies.
Back to Tools Covered
Measurement Range Template (including Target Weight Range Template)
The Measurement Range Template allows you to set desired measurement ranges (minimums and maximums) for your Enclosures, Life Supports and Components. It also provides a means for notification should a reading be outside these ranges.
Creating a Measurement Range Template
Enclosure/Life Support/Component Assignments
Using a Measurement Range Template
Creating a Measurement Range Template
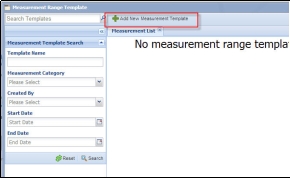
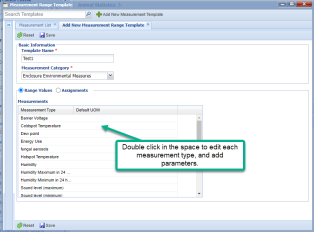
Open the Measurement Range Template from the tools menu (Start Tools Measurement Range Template).
Adding Parameters
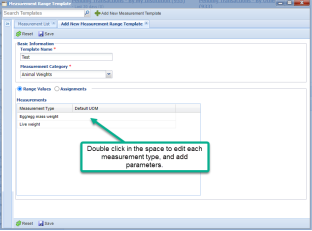
The range templates will auto-populate with each measurement type available for that measurement category.
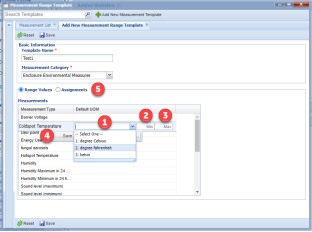
Double click in the ‘Default UOM’ column for each measurement type to edit the default unit of measure (1), minimum value parameter (2) and maximum value parameter (3). Click save (4) to save that measurement type settings.
Repeat for all the measurement types you want to set, if you do not want to set parameters for certain fields then leave them blank.
Once all desired parameters have been set, toggle from “Range Values” to “Assignments (5) to start assigning your enclosures/life supports/components.
Enclosure/life support/Component example screen:
Animal weight example screen:
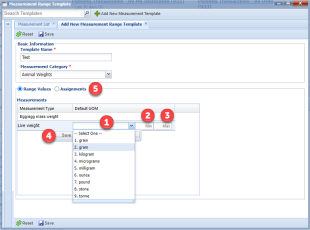
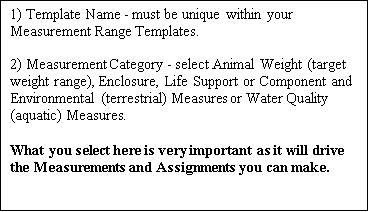
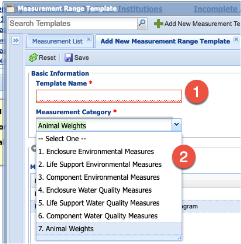
1) Default UOM - select your desired Unit of Measure from the drop down list (can be edited later)
2) Min - record the minimum measurement desired
3) Max - record the maximum measurement desired
4) Save - each grid must be Saved individually. Continue down the list until you have entered all your desired ranges.
5) Assignments toggle – takes you to the assignments screen to assign which enclosures/life supports/components should have your parameters assigned.
Environmental measurement Assignments (Enclosure, Life Support, Components)
When first creating your range template, there will be no assignments. To start, click the “Add New” button (1) to add your first assignment (in the screenshot below, add new has already been ticked).
The assignments you can choose will be limited by the type of Measurement Category you have chosen. In the screenshot below, we have chosen ‘Enclosure Environmental Category’, therefore we can only assign ‘Enclosures’ (2). Start typing in the assignment box to select your desired enclosure, and click to select, then click ‘Save’ (3). Each assignment needs to be added and saved individually, to add more simply re-click ‘Add new’ (1).
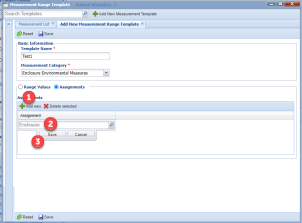
1) Add New - select this to bring up the grid to record your enclosures, life supports or components
2) Assignment - select the desired Enclosures, Life Supports or Components. IMPORTANT! You will be able to assign ONLY from the category that you selected. For example, if you selected a category of Life Support Water Quality Measures ONLY aquatic life supports will be available. If you selected a category of Enclosure Environmental Measures ONLY terrestrial enclosures will be available.
4) Save - save each assignment individually
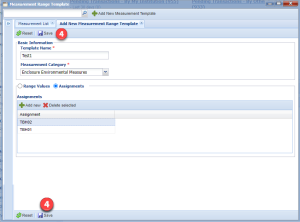
Check all your parameters and assignments are correct, then click Save (4) to save the whole template.
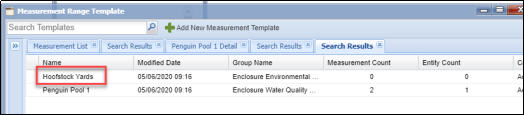
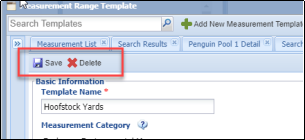
To edit or delete the Template, double left click on the name in the list.
You can select to edit as desired and Save, or Delete the Template. No data entered that referenced the desired ranges before the Template was edited or deleted will be changed.
Animal Weight Assignments
When first creating your range template, there will be no assignments. To start, click the “Add New” button (1) to add your first assignment (in the screenshot below, add new has already been ticked).
In the Animal Weight measurement range template, the assignments are individual animals. Start typing in the assignment box (2) to select your desired animal, or use the magnifier to choose multiple animals.
Choose the ‘Start Date’ (3) – this is the date from when the weight range template should be applied. Choose the ‘End Date’ (4) if applicable. If you want to have this template ongoing then leave this ‘End Date’ field blank – you can come back and edit it later if you want it to end.
Add any applicable notes (5) then click ‘Save’ (6) to save this assignment. To add another animal simply re-click ‘Add new’ (1) and repeat the process.
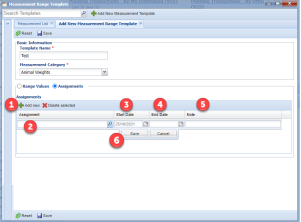
1) Add new button – Add a new assignment
2) Assignments – Type ahead to add select a known animal ID or use the ‘search glass’ for an advanced search
3) Define the Start Date (required)
4) Define the End date (optional) (Note, adding a second range for the same animal will automatically add an End Date to the previously entered range)
5) Note – Add any applicable notes
6) Save button for assignment
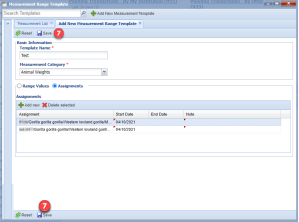
7) Save button for whole template
Check all your parameters and assignments are correct, then click Save (7) to save the whole template.
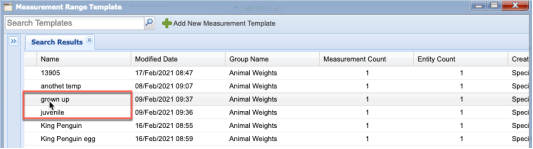
Your Template will display in the list.
Note, you can have more than one Weight Template range of the same animal to note expected changes through life stages.
To edit or delete the Template, double left click on the name in the list.
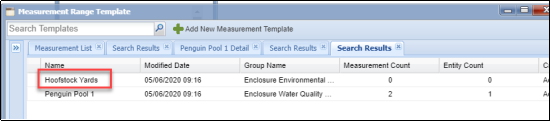
You can select to edit as desired and Save, or Delete the Template. No data entered that referenced the desired ranges before the Template was edited or deleted will be changed.

Using a Measurement Range Template
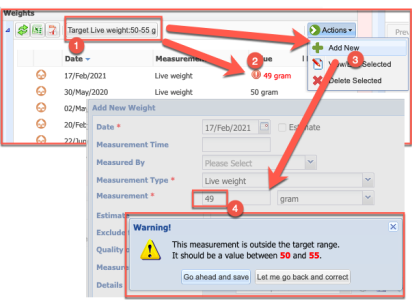
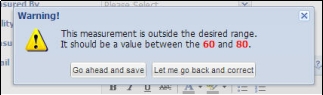
Because you have created a Measurement Range Template, when you record a measurement on an assignment that is outside the desired range you will receive a message when you select to Save the measurement. You can save it if the measurement is correct, or go back and correct if it is incorrect.
For Animal Weights:
- When a range is in effect for the animal, you will see the active range displayed at the top of the weight grid
- When values are entered in the active date range and are out of range, they will be flagged in red in the weight grid
-
When adding new weights in the active range, if values are out of range you will be notified of the expected range.
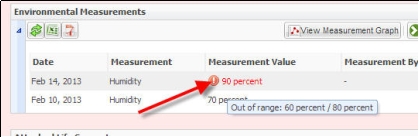
For the Measurement grids:
ZIMS will display the measurement that is outside the desired range in red.If you hover the mouse over the "!" the desired range will display.
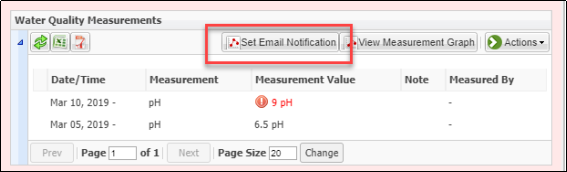
Email Notification
For enclosures and life supports, often the person recording the measurement is not the one who needs to be notified if a reading is outside the desired range. You can send an Email to the Staff member who should be notified. Once a measurement has been recorded on an entity the “Set Email Notification” button is activated. Select this to set up your notifications.
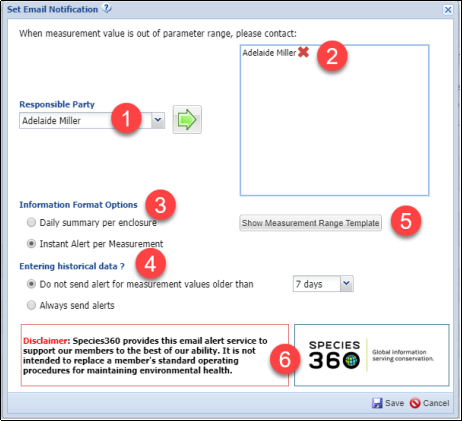
1)Select who you want the Email to go to. This is sourced from your Staff list and you can assign multiple people. NOTE: In order for the name to appear on this list the Staff member must have access to Basic Detail and Measurements in the Enclosure and/or Life Support & Component modules.
2)To remove their name from the Email use the red “X”.
3)They can receive a daily summary by entity or they can receive instant Emails. Daily Summaries are sent at noon in your time zone. This allows measurements to be taken in the morning and any corrections can be made in the afternoon.
4)You can select if you want an Email sent if the measurement is recorded on a previous date.
5)You can go directly into the Measurement Range Template from here. If there was no Template on the enclosure this button would say “Add Measurement Template”.
6)This functionality is not meant to replace Best Practices for the operation of your institution.
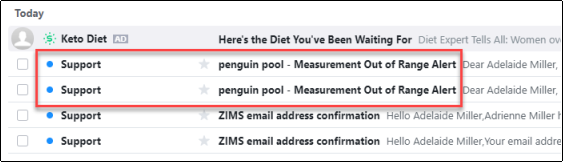
The Email will come from Support and the title will include the entity and Measurement Out of Range Alert for Instant Notifications. For Daily Summaries it will just say Measurement Out of Range Alert.
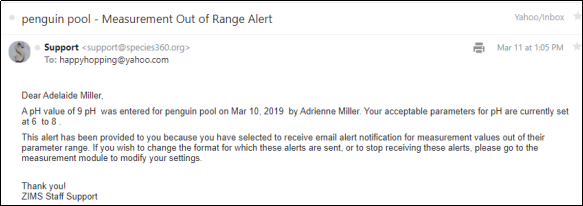
Above is an instant notification Email. The text will include the measurement, the date and what your desired parameters were.
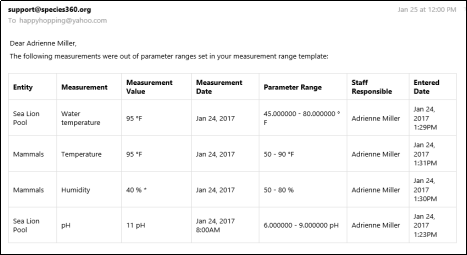
Above is a Daily Summary Email.
Back to Tools Covered
Data Export (to MedARKS)
As of January 2020, all MedARKS functionality (and more!) is available in ZIMS. Some institutions are still using this Tool to export their ZIMS data to MedARKS for Sample Storage, but the best practice recommendation is to stop using MedARKS and wait for migration of your historical Sample Storage data. While you can still request a MedARKS export, we will no longer be fixing any bugs, export failures, etc. If you need help running this Tool please contact support@species360.org .
Back to Tools Covered
Environmental Quality Graph
The Help document for this Tool is quite lengthy as there are many options. It is available as a standalone document here Environmental Quality Graph
For a PowerPoint with examples for using this Tool see Environmental Quality Graph
Back to Tools Covered
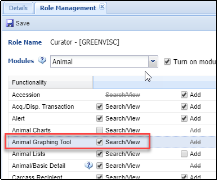
Animal Graphing Tool
When graphing multiple animals, you have the option to create the graph by animal or by record type. What you select will affect how the graphs are produced. For example:
-
If you select to graph 3 animal’s weights and feed logs by
Animal:
- ZIMS produces 3 graphs, each with the weight and feed log of one animal
-
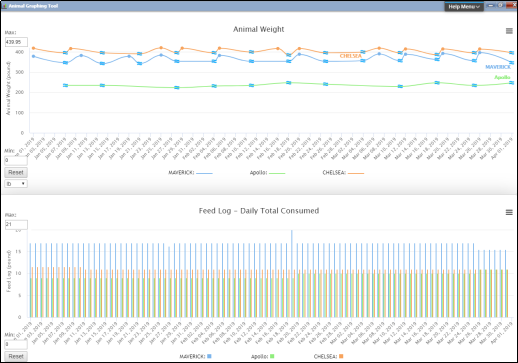
If you select to graph 3 animal’s weight and feed log by
Measurement Type:
- ZIMS produces 2 graphs, one for the weights of all 3 animals and one for the feed logs of all three animals
Measurement Types that can be graphed are Feed Logs, Weights, Lengths, Care and Welfare entries and Enclosure Environmental/Water Quality Measurements. For additional help with these topics see:
- Add Feed Logs
- Add Weights
- Add Lengths
- Care and Welfare
- To compare two sets of weights by age use this Excel tutorial
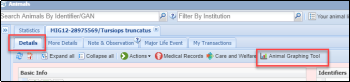
In addition to being found under the Start menu, the Animal Graphing Tool is found at the top of the animal record when the Details tab is selected.
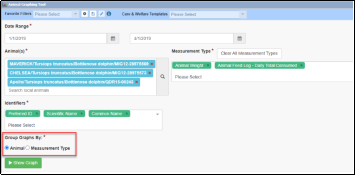
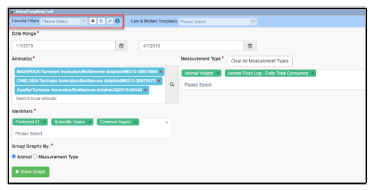
Below we are selecting a single measurement for multiple animals.
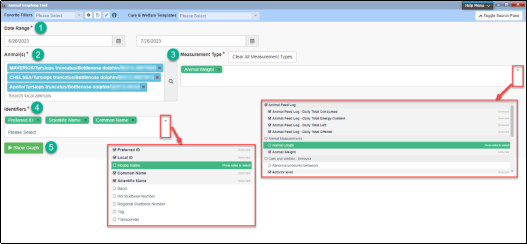
1) Select the desired Date Range. The default is for the last 30 days.
2) Select your animals. You can use the magnifying glass to open up an animal search (details below).
3) Select your Measurement Type.
- The dropdown menu allows you to select multiple measurement types to plot on your graph(s).
- Measurement types are grouped, and allow for single selection or whole group selection.
- Select the identifiers that you want to show on the graph. Preferred ID, Scientific Name and Common Name will show by default but you can amend this through the dropdown list.
- Select Show Graph.
If you are unsure of which animals you are looking for, you can use the Animal(s) search by clicking on the magnifying glass. Simply choose your required search fields and click search to bring up the results.
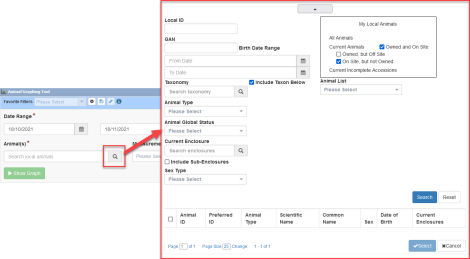
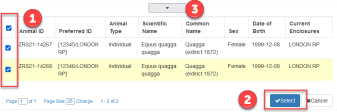
Clicking Search will bring up a list of animals at your institution that fulfil those search requirements. Choose the animals you want to select (1) then click the Select button (2) to add them to the Animal(s) box in your graph. If your search results were not narrow enough, click on the drop down button (3) to bring the search menu back down and add more search critera.
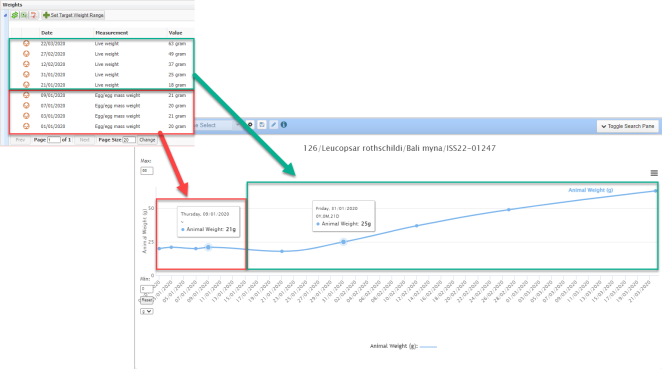
When graphing weights, the Animal Graphing Tool graphs both egg and live weights. In the graph below you can see the egg weights in the red box. If you hover over any of these data points you can see the date recorded and weight, but no age as the animal has not hatched. The live weights are represented in the green box, when you hover over any of the live weights you will see the date recorded, weight and age of the animal.
Below is a graph for Animal Weights for 4 bottlenose dolphins from 1 January to 1 April 2019.
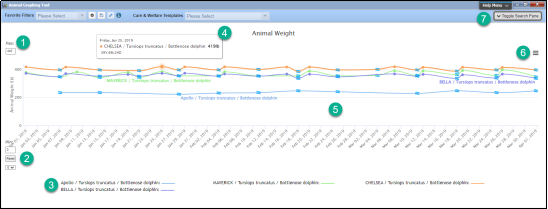
1) You can adjust the Y axis as needed.
2) You can reset the Y axis using the Reset button.
3) The color code for the animals displays at the bottom.
4) Hovering over the point in the graph will display the data recorded and identifiers.
5) Estimated dates will be indicated.
6) Using the hamburger icon you can Print or Download the chart.
7) You can go back to the filter screen using Toggle Search Pane.
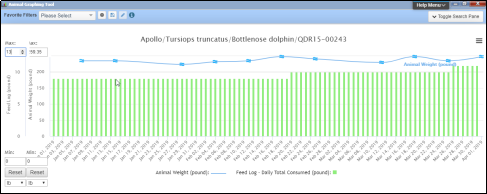
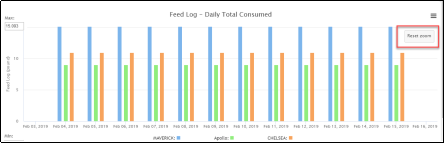
Below we have chosen to graph a single animal’s weight compared with its Feed Log (Daily Total Consumed).
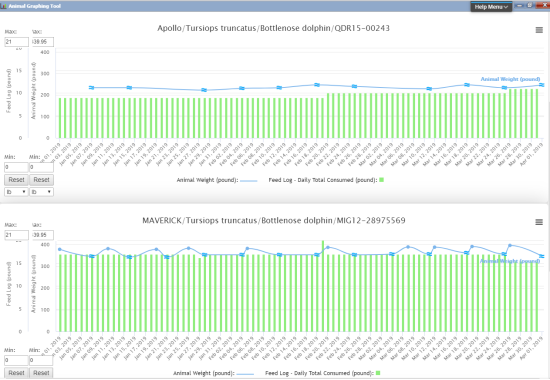
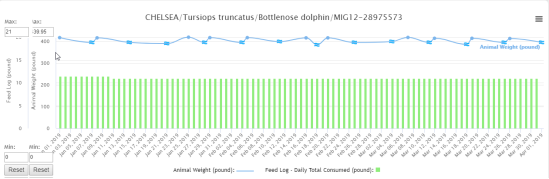
We now want to compare Weights and Feed Logs for 3 animals. This activates the option to select graphs by Animal (3 separate graphs will be produced, one for each animal graphing Weight and Feed Log) or Measurement Type (2 separate graphs will be produced, one for each Measurement Type comparing the animals selected).
Group by Animal was selected for the graphs below:
Group by Measurement Type was selected for the graphs below:
For the graph below we have selected to graph Animal Weight and entries under Care and Welfare – Behavior.
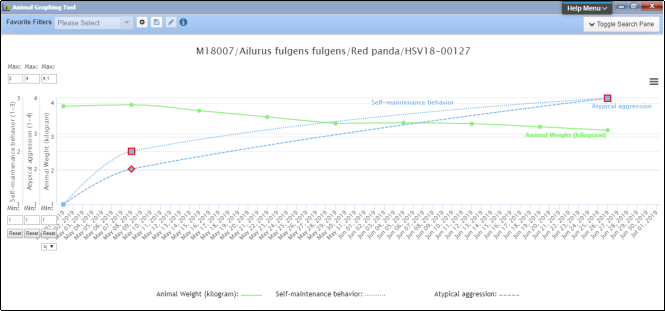
You can quickly see that as the animal’s self-grooming and atypical aggression increased, its weight decreased.
This tool is also useful to compare Environmental/Water Quality Measurements with measurements such as Animal Weight and Feed Log or behavioral concerns and quickly can let you know if the environment is affecting the animals mental or physical health. Moves between enclosures are taken into account and Environmental Measurements will only display when the animal was occupying the enclosure.
Use your mouse to highlight an area of the graph and zoom in for details. Select Reset zoom to go back to the original graph display.
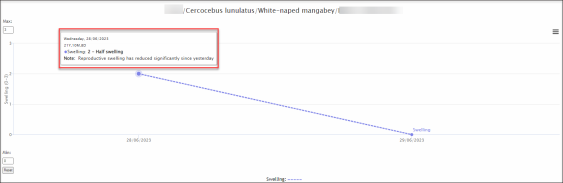
When displaying the Animal graphing tool for Care and Welfare indicators, any data point that is hovered over will display notes associated with that indicator value.
For graphs you run on a regular basis you can create Favorite Filters, and then choose from the dropdown later to prefill the Animal(s) and Measurement Type fields.
Select from the Care & Welfare Templates dropdown to prefill the Animal(s) and Measurement Type fields relevant to the template.

Back to Tools Covered
Revised 5 March 2025