


REPORTS IN ZIMS HUSBANDRY
Contact support@Species360.org
 The list of Husbandry Reports that are available to you are found under the Start button > Reports. Report access is granted by your ZIMS role, if you are looking for a report that is mentioned here, but you do not see it in ZIMS, contact your local administrator for help.
Reports are also available via exporting data to PDF and Excel throughout ZIMS.
It is important to note that recently entered data may not appear on reports or exports for 180 seconds after the data was entered.
This is because reports and exports in ZIMS are run from a different server than the data is collected on. This assures that requests for large amounts of data being run will not slow down ZIMS for data entry needs.
For help on which report to run for your inventory/permitting needs, see this guide:
Help with Inventories and Reporting
.
For details on how ZIMS Reports filters institutions by country/continent, see this list:
ZIMS Institutions – countries and continents
.
The server from which ZIMS reports are served is different from the ZIMS application server. If you are unable to run reports, please have your IT staff add the following to your whitelist: IP=50.31.180.180 & IP=50.31.180.181 | URL’s=
https://zimsapp3.Species360.org
&
https://zimsapp4.Species360.org
Topics Covered
|
Troubleshooting export to Rich Text Format (RTF) |
Impact on Report of Group Census Versus Group Partial Transactions |
Favourite Report Filters
Saving report filters into your favourites list in ZIMS helps you to save time and helps avoid errors in selecting your report filters for commonly used Reports. Almost all the Reports in ZIMS have the option to set Favourite Filters.
To save a filter open the report and complete your desired filters for the report. Below is a Taxon Report screen. We are creating a filter to be used as our default for running Taxon Reports for our carnivores. All mandatory fields must be completed. All fields will be editable when you actually use the filter. When done, select the Save icon at the top.
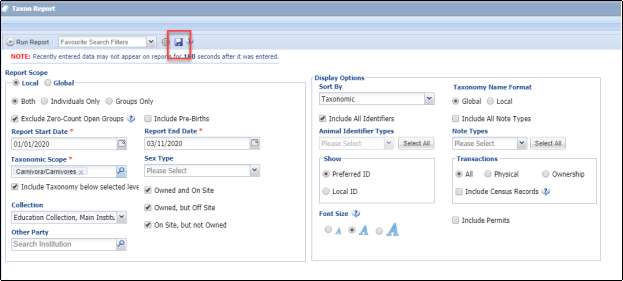
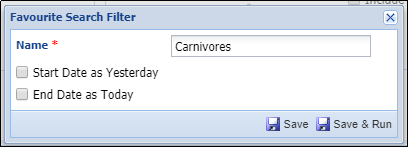
1. Name - must be unique within each report
2. Start Date as Yesterday - checking this will make the Start Date of your report Yesterday. This date will update daily.
3. End Date as Yesterday - checking this will make the End Date of your report today. This date will update daily.
4. Save - This will Save the filter to your Favourites.
5. Save & Run - This will Save your filter to your Favourites and also immediately run the report.
Some saved filters have the option to share the filter with others.
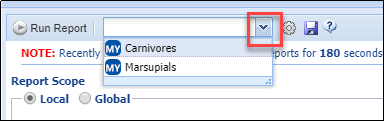
To find your Favourite Filters, use the drop down arrow to the right of "Favourite Report Filters" box. Then select the appropriate filter name. All fields are editable and if changed to run the report it will not affect your saved filter.
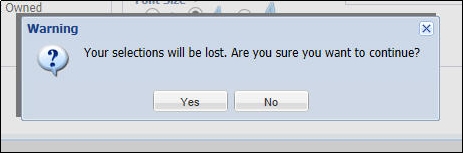
If you change filters you will be given the message below that your selections will be lost. This only means that you will be changing the selected report filters as seen on the screen because you are changing to a different saved filter.
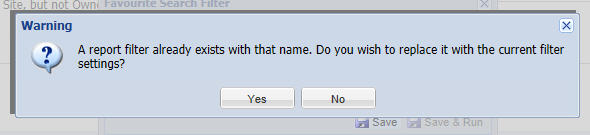
To edit a saved filter simply open it up and make your changes. Select to Save it and name it as it was before (if you want to keep the edits) or record a new name (if you want to keep both filters saved). If you keep the old name you will receive the message below that a filter with the same name exists. If you select Yes, the edits will be saved.
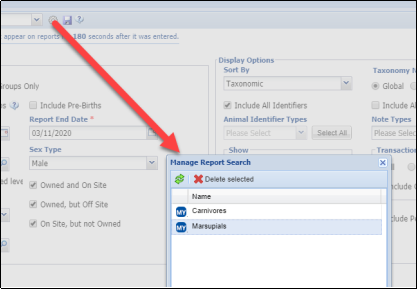
To delete a saved filter, select the Manage Report Filter icon, highlight the desired filter and select Delete Selected.
Back to Topics Covered
Exporting Reports
Exporting Options for Reports
All of the Reports have options for exporting though these options are not all the same. The following Reports can be exported to Raw Excel directly from the report filters screen:
- Activity Report
- Enclosure Occupants Summary Report
- Enclosure Report
- Global Permit Report
- Inventory Summary Report
- Inventory Detail Report
Inventory Detail Report, Raw Excel output, has a series of column headers with coded terms. Here’s a list of the coded column headers and their definitions:
- treesort3: helps sort the list taxonomically
- OosToIol_M: Owned on site changed to In on loan (male)
- OosToIol_F: Owned on site changed to In on loan (female)
- OosToIol_O: Owned on site changed to In on loan (other)
- OosToOol_M: Owned on site changed to Out on loan (male)
- OosToOol_F: Owned on site changed to Out on loan (female)
- OosToOol_O: Owned on site changed to Out on loan (other)
- IolToOos_M: In on loan changed to Owned on site (male)
- IolToOos_F: In on loan changed to Owned on site (female)
- IolToOos_O: In on loan changed to Owned on site (other)
- OolToOos_M: Out on loan changed to Owned on site (male)
- OolToOos_F: Out on loan changed to Owned on site (female)
- OolToOos_O: Out on loan changed to Owned on site (other)
- OosToIol_M: Owned on site changed to Out on loan (males)
- OosToIol_F: Owned on site changed to In on loan (females)
- OosToIol_O: Owned on site changed to In on loan (other)
- OosToOol_M: Owned on site changed to Out on loan (males)
- OosToOol_F: Owned on site changed to Out on loan (females)
- OosToOol_O: Owned on site changed to Out on loan (other)
Additional exports:
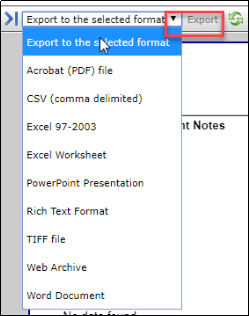
Some Reports can be exported to various formats after the Report has been run by selecting the format desired and then Export. The Export option will not activate until you select a format.

Some Reports can only be exported to Excel or PDF. These Reports are:
- Peak Holding Report
- Taxon Report
- Transaction Report
You can print most Reports directly by selecting the printer icon at the top.
Troubleshooting export to Rich Text Format (RTF)
Sometimes, when exporting a ZIMS report to Rich Text Format, you may find that it appears some text has been cut off or "lost":
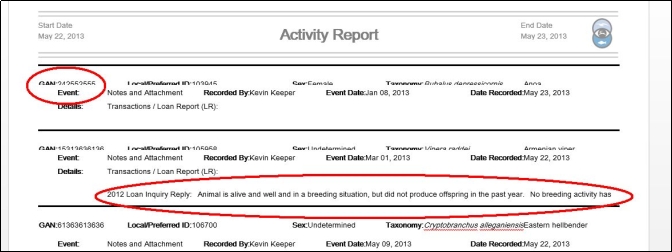
This is caused by limitations of the word-processing software, but is easily fixed. Click anywhere in the report itself (below the header, in the actual report.) You will see a small "+" icon appear in the top
left:
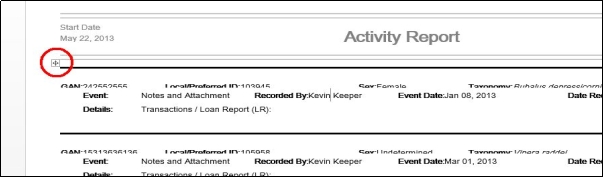

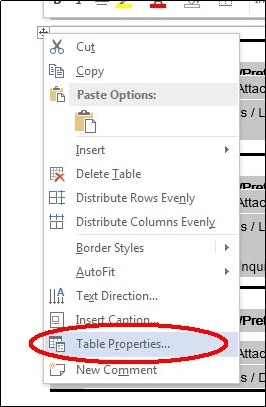
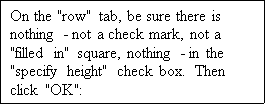
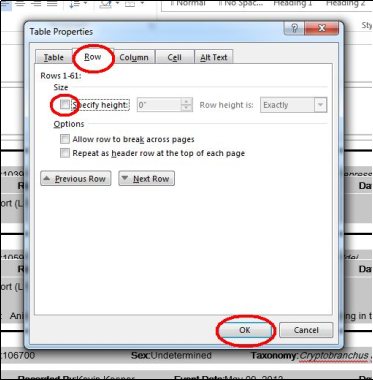
You will see that previously-hidden parts of the report are now visible!
Back to Topics Covered
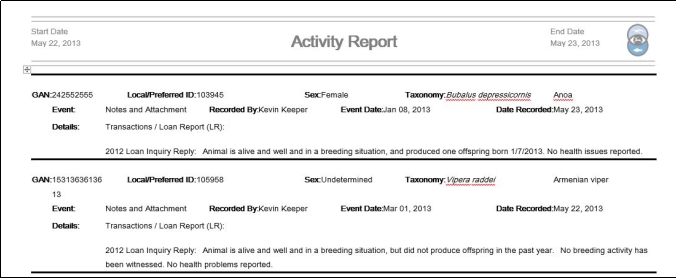
Activity Report
This Report captures animal data reported over a specified time frame.
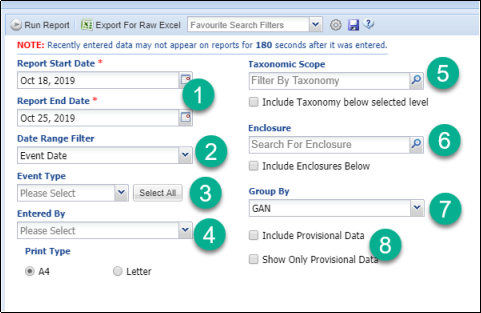
- Enter the date range for the report
-
You can select to run the report for when the event occurred, when it was recorded, or both.
If you want to narrow activities by either the day the event was recorded or occurred, you should pay close attention to the Date Range Filter settings. - This is a multiple select list for the type of event you want to include
- You can filter the report by who entered the data
- You can filter by taxonomy
- You can filter by enclosure
- Select how you want the report grouped
- You have the option to include Provisional data or run the report only for Provisional data
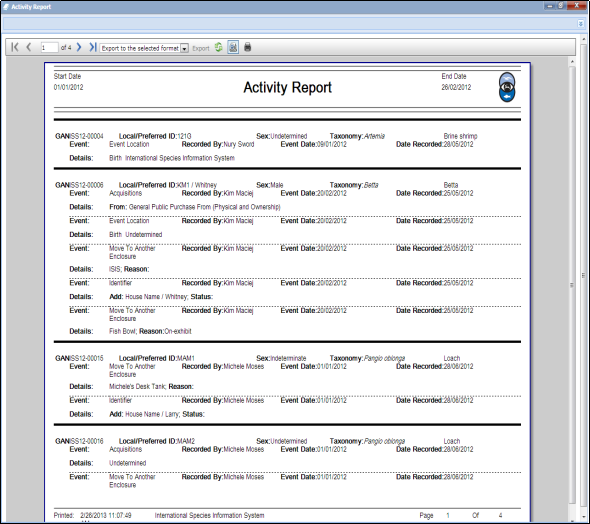
Below is an example of an Activity Report sorted by GAN. Navigation appears on the top bar.
Daily Report
This Report was designed to quickly provide a report for a day’s happenings across your facility. This report is often used by Keepers/Aquarists to review what happened in their area the previous day or the days when they were off. It is equally useful for many other Staff members such as Curators and Department Heads.
Depending on the filters selected, this Report can include data on Enclosures, Life Supports and Components as well as Animals. When run for Enclosure’s the ‘animal data’ is presented for any of the current occupants for the selected enclosures/enclosure list.
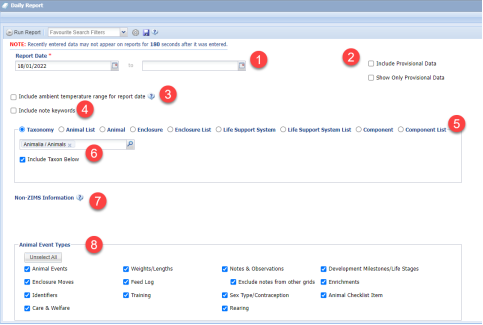
- Although the Daily Report is usually a report for a single day you can select a Date Range for the report. This Date Range is limited to a month maximum.
- You can select to include Provisional Data or to show only Provisional Data in the report. This option will only display if you have Provisional data turned on for your institution.
- You can include the ambient temperature range for the report date. This information is sourced from measurements recorded in your top-level enclosure (your institution).
- You can include Note and Observation keywords.
- The report can be filtered by specific Taxonomy, Animals, Enclosures, Life Supports and Components. What makes it especially useful is that it can be filtered using Lists, so the report can be run by Teams or Keeper strings. The lists drop down will not provide any options if you do not have lists created ye t.
- What entity you select above will drive your options to select/record in this box.
- The non-ZIMS Information box allows you to capture information that is not recorded elsewhere in ZIMS. This can include things like extreme weather conditions, non-normal staffing and reminders for the following day such as needing to restock items.
- We selected Taxonomy = Animalia so the Animal Event Types display. All Event Types are checked by default but you can uncheck events that you do not want to include. Note you can now include Care and Welfare information into your daily report, and choose to exclude notes from other grids (e.g. training, enrichment, identifier notes) when selecting Notes & Observations.
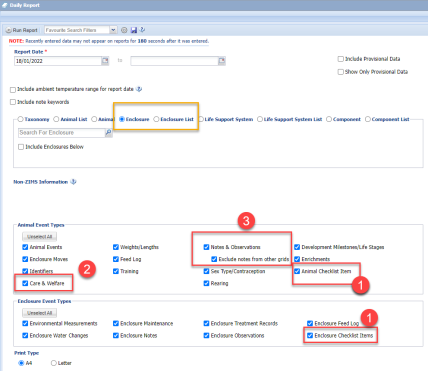
Below when we select an entity of Enclosure or Enclosure List. This selection activated the Enclosure Event Types.
Notice, you can now report on Animal, Enclosure, Life Support or Component Checklist Items (1) added from
Husbandry Log Entries
in the Daily Report,
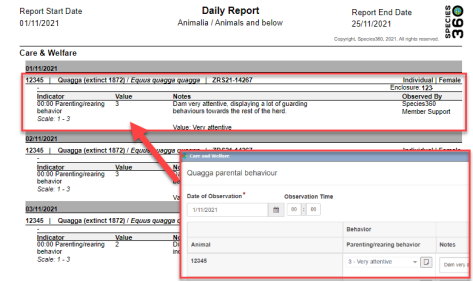
Care and Welfare
information (2), and choose to exclude notes from other grids when viewing Notes and Observations (3).
If you want to search for all Life Support or Component Check List Items for a given date range:
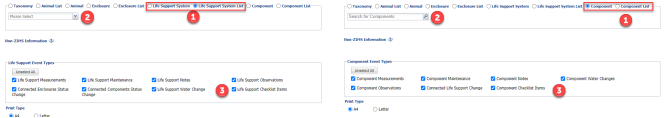
- Check the box for that entity type
- Leave the Search Box blank
- Enable Checklist Items
You can run the Daily Report by ‘Entered By’ - this allows you to select the individual(s)/ team(s) of users as the data enterers that will be included in the report output:
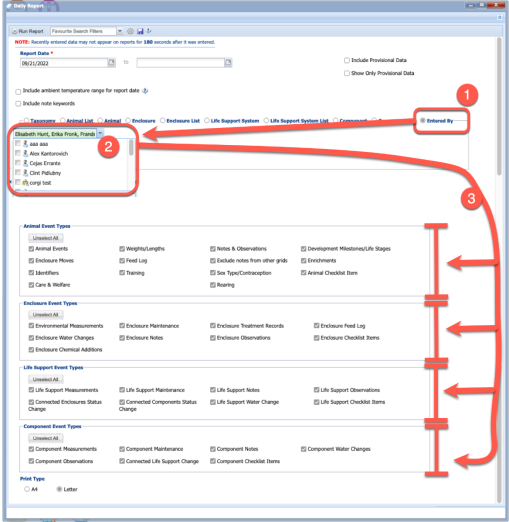
- When filtering by “entered by”
- You will select from the drop-down individual(s) and/or team(s) who completed data entry
- Given you are searching by the person(s) who completed the data entry, and not the ‘entity type’, you are able to produce the daily report with any/all of the entity types included.
Example report of checklist items, entered from Husbandry Log Template:

Below is an example of how Care and Welfare information is displayed in the Daily Report:
Below you will find an example report highlighting the other layout options for consideration.

The report output is sorted by topics such as Animal Events, Enclosure Moves, Identifiers and Weights and Lengths for ease of locating specific information recorded for a single day.
The temperature displays at the top and any Non-ZIMS Information at the bottom.
Any data that remains Provisional will display with an “*” next to the row.
Back to Topics Covered
Enclosure Activity Report
An Enclosure Activity Report lets you find the activity carried out on your Enclosures/Tanks during a specified date range.
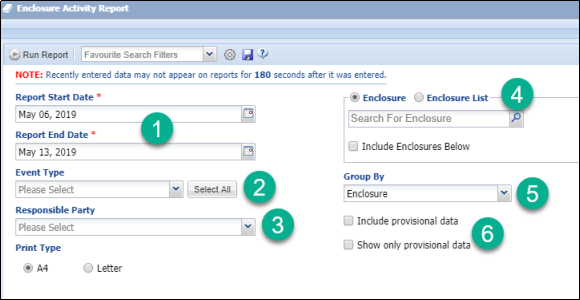
1.Enter your desired date range.
2.Select what Event Types you wish to include. This is a multiple select dropdown for events such as measurements, maintenance, feed logs, animal moves and notes. If you want to include all Event Types use the Select All button.
3.You can filter the report by a specific Responsible Party.
4.You can select a report for a single Enclosure or for an Enclosure List. Include Enclosure Below is only activated for a single Enclosure. If you want the report for multiple Enclosures, you will need to create an Enclosure List.
5.You can group by the Enclosure, the Event or the Date.
6.The options for Provisional Data will display ONLY if you have Provisional activated for your institution.
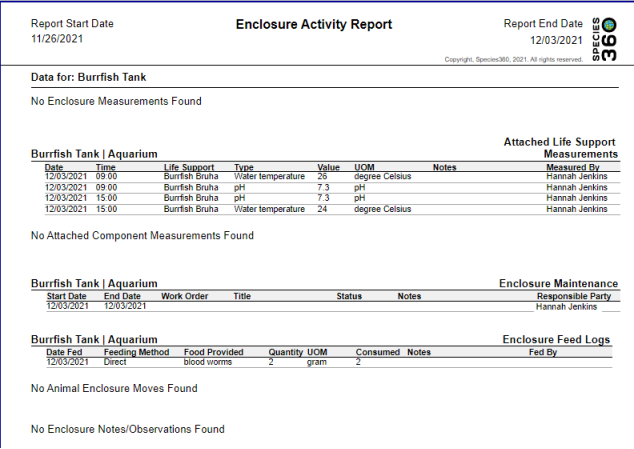
Below is an example Enclosure Report for a single tank on a single day. You can now see the times of life support and component measurements to help track multiple entries in one day.
Back to Topics Covered
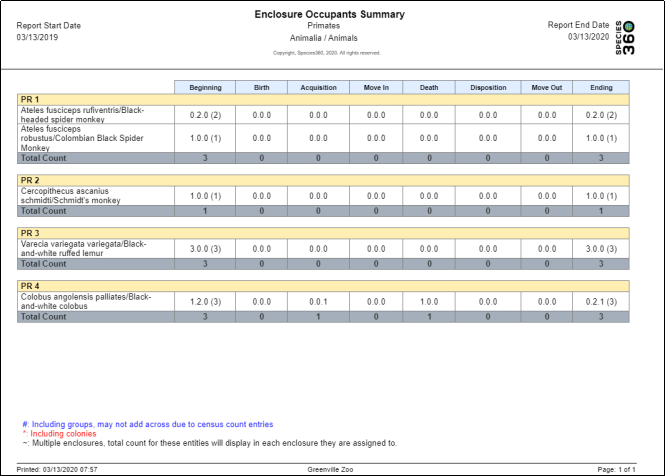
Enclosure Occupants Summary Report
This provides an inventory like Report of the numbers by species occupying an Enclosure during a specified time range.
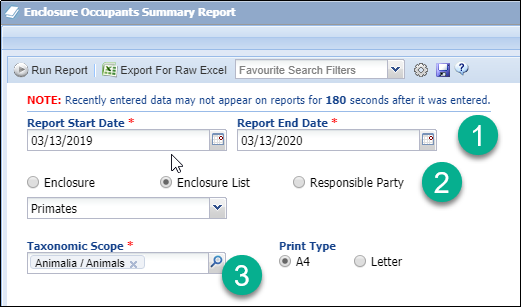
1.The default Date Range is for the past week but can be edited.
2.You can select by individual Enclosure(s) or Enclosure Lists (if you have them) or by Enclosure Responsible Party.
3.You can filter by Taxonomy.
The Report shows the number of animals by species at the beginning and end of the selected Date Range as well as any additions and deletions to the numbers. Individual animals/groups are not identified.
Back to Topics Covered
Enclosure Report
This Report provides a list of occupants for a specified Enclosure during a Date Range. The advantage of this Report is that the actual animals/groups are identified.
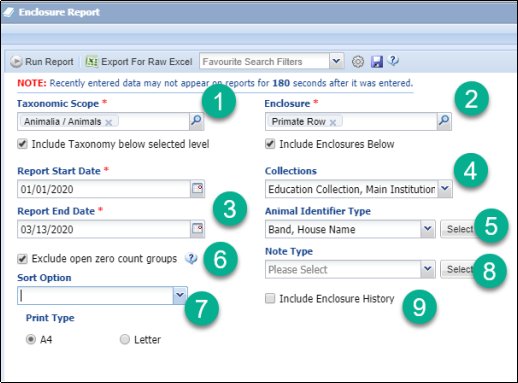
1.Select the desired Taxonomy; Include Taxonomy below checked by default.
2.Select a single Enclosure or an Enclosure List. For multiple Enclosures you will need to create an Enclosure List.
3.Enter the desired Date Range.
4.All Collections are included by default but can be edited.
5.Identifiers can be included.
6.Excluding open groups with a count of zero is checked by default.
7.Sort Option functionality is not available at this time; sort is by Enclosure.
8.Including Note Types functionality is not available at this time.
9.Include Enclosure History functionality is not available at this time.
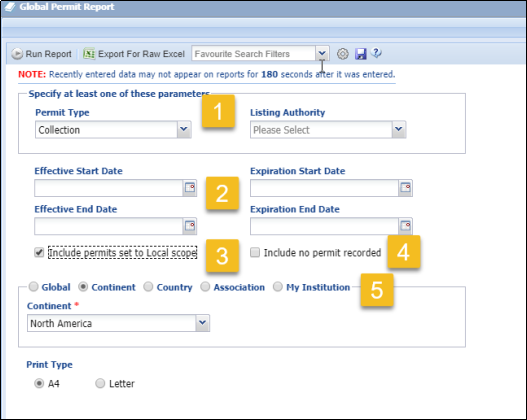
Below is the report run for the filters selected above. The date (highlighted) is the Birth/Hatch Date or the Established Date for a Group.
Back to Topics Covered
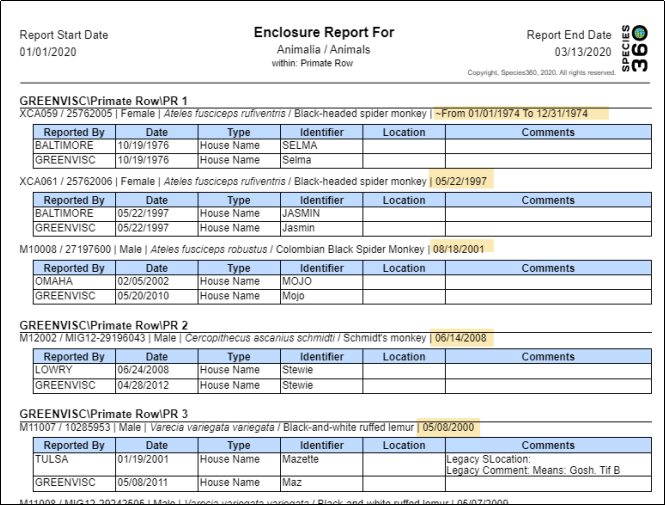
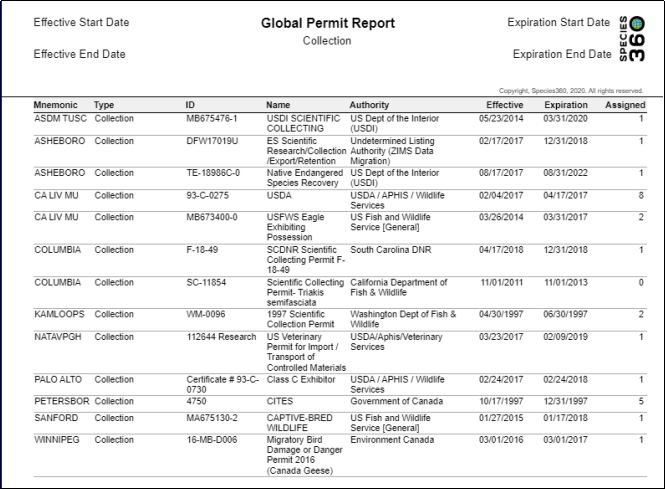
Global Permit Report
Institutions have the option to mark a Permit as visible globally This is very helpful when another institution needs to reference your permit number such as for Captive Bred Wildlife registration in the United States and BALAI registration in Europe.
1.You need to select either a Permit Type or a Listing Authority. You can select both.
2.You can filter by Effective Start Date and Expiration Date Ranges. If no date entered the search will be open ended.
3.Include Permits set to Local scope will only return data on your institution’s permits. You will not see any data for another institution’s Local permits.
4.Include no permit recorded will display the name of the institution with no data. This can be helpful when trying to find out if an institution has that type of permit but has just not marked it as Global scope.
5.You can filter from Global scope (all institutions in ZIMS) down to your institution.
The Report below was run using the filters above.
Exports
i-FAP
This is a custom report for French members serving their i-FAP annual reporting requirements.
and was designed strictly for use by institutions in France to meet year-end i-FAP reporting requirements. Clicking the report will immediately export the report to Excel; there are no parameters to select prior to running the report. The format replicates the design required for submission.
Access to this report is assigned to the Local Admin Species360 template Role. If others require the ability to run this report, that access will need to be assigned to their custom Role.

Rapport i-FAP
Ceci est un rapport personnalisé pour les membres français répondant à leurs obligations en matière de rapports annuels pour i-FAP.
Ce rapport se trouve sous Démarrer> Rapports> i-FAP et a été conçu pour être utilisé strictement par les institutions françaises afin de se conformer aux exigences de rapports de fin d’année. En cliquant sur le rapport, le rapport sera immédiatement exporté vers Excel; il n'y a pas de paramètres à sélectionner avant d'exécuter le rapport. Le format reproduit la conception requise pour la soumission.
L'accès à ce rapport est attribué au rôle de modèle Local Admin Species360. Si d'autres personnes ont besoin de pouvoir exécuter ce rapport, cet accès devra être attribué à leur rôle personnalisé.
SAFE for Chondrichthyes Census
This report was developed from the AZA SAFE (Save Animals From Extinction) for Sharks and Rays program. It is an Excel export that is compatible with the SAFE for Sharks and Rays database upload tool. There are no parameters to select prior to running the Report. It will return the following data on all Chondrichthyes currently held by your institution:
- ID – This is the SAFE for Sharks and Rays Project ID and assigned by AZA
- Accession Number – Local ID
- GAN
- Scientific Name
- Common Name
- Group or Individual – “0” for individual, “1” for group record
- Population – sex count in M.F.U format
- Birth Date Start
- Birth Date End
- Last Updated
- Notes
Back to Topics Covered
Inventory Detail Report
This Report displays the starting and ending counts of species during a date range. It can include both animals physically held and/or legally owned, depending on the filters selected. Columns indicate ins and outs for your institution.
Using the Report
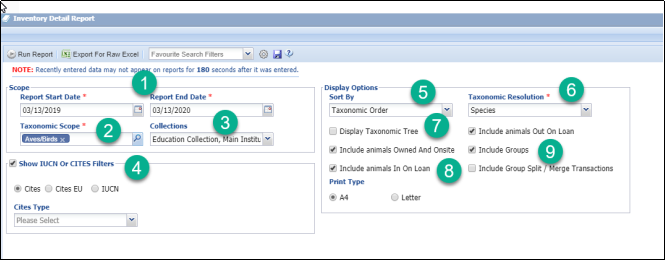
1.The Start Date defaults to the beginning of the year and the End Date defaults to today, but both are editable.
2.Select the Taxonomic Scope you desire.
3.By default all Collections are included but these can be edited.
4.Checking the Show IUCN or CITES Filters will activate the fields below to select from. The CITES and IUCN status will display by default even if this is not checked. This option allows you to run an Inventory Report for only those species meeting the criteria selected.
5.You can sort by the Taxonomic Tree or by Scientific Name alphabetically.
6.Taxonomic Resolution allows you to have the Report display from Superkingdom down to Breed and below. If you have domestics that you want to display as such you will need to adjust the Taxonomic Resolution.
7.Checking Display Taxonomic Tree will include all levels above the Taxonomic Resolution selected (see example below).
8.You then need to select the physical and ownership status you want displayed. These will each show as their own line in the Report.
9.Groups are not included by default. Checking Include Groups will activate the option to Include Group Split/Merge Transactions. These are not usually included as often group Splits and Merges do not involve actual number changes for your collection.
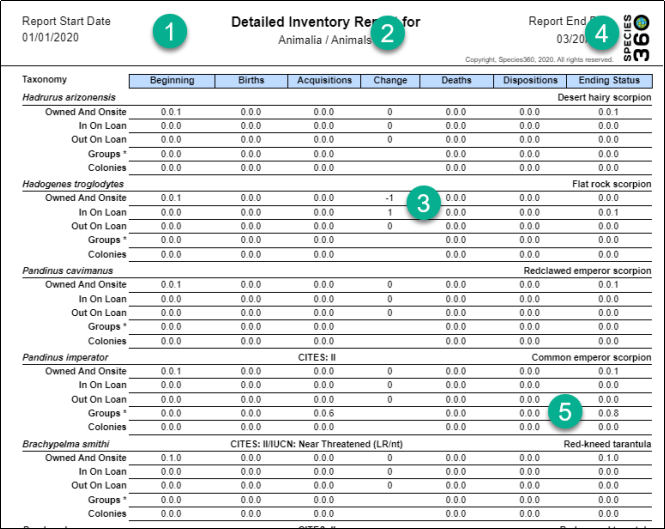
Some things to note about the Report:
1.The first column is the count on the Report Start Date.
2.The Change column indicates an Ownership or Physical status change during the time period of the Report. In the Report above we still physically held the Flat rock scorpion but we had given ownership to another Institution. 3. The Owned and Onsite count was reduced by one (-1) and the In On Loan count was increased by one (1).
4.The last column is the count at the Report End Date.
5.Groups only have one line and it includes all variations of Physical and Ownership. If you have used a Census to record the count change in the group, the line may not add up across as ins and outs are not captured. See Impact of Group Census Versus Group Partial Transactions for more information on this.
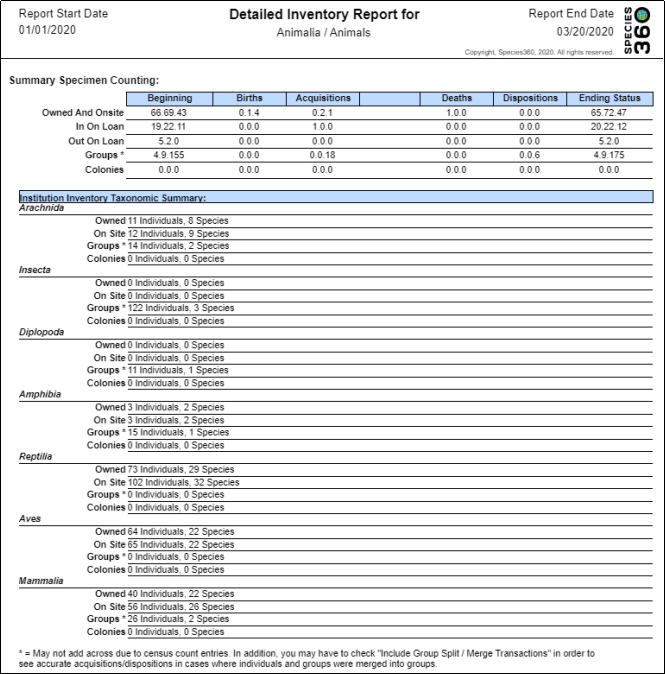
At the end of the Report is a summary grid for the counts of specimens within each column. Below that is a breakdown of the Species (or whatever you selected for your Taxonomic Resolution in your Report filters) counts.
Impact in the Report of Group Census Versus Group Partial Transactions
ZIMS offers two methods to track the changes in numbers of your Group records:
- Census - Record a count of the population using the desired tracking for the Group
- Partial Transaction – Record additions or deletions to the Group by selecting a transaction type and recording the numbers associated with it
Some institutions use one or the other, but the majority of institutions use a mix of the two methods. How these methods are reflected on the Inventory Report are different, and you need to understand the differences to make sure the method you select works for you and you can accurately interpret the report.
CENSUS ONLY
Census counts are not reflected in the Inventory Report because no addition or deletion Terms are recorded. We recorded the following Census Counts:
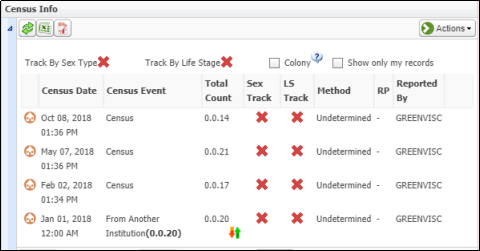
We ran a Detailed Inventory Report for 1 February 2018 through 8 October 2018:
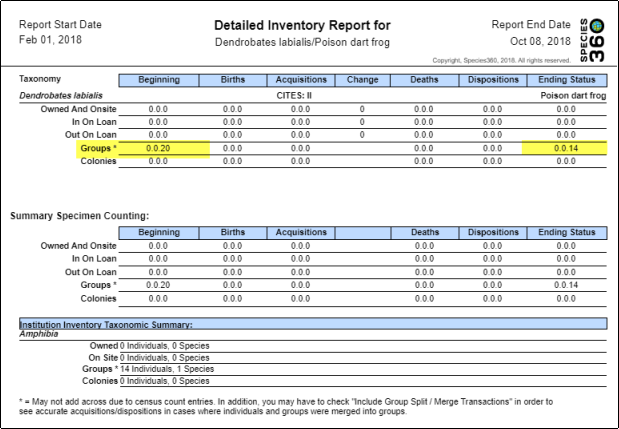
The Beginning count is 20 because the Group was acquired prior to the report Start Date. The Ending Status is 14 because that was the last Census recorded before the End Date. The two Census Counts taken in between are not reflected because no actual addition or deletion Terms to the Group were recorded. The numbers do not add up across and this is correct.
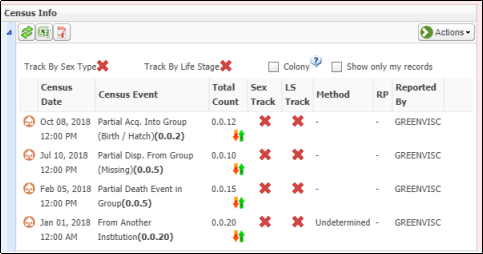
PARTIAL TRANSACTIONS ONLY
For the next Group we recorded Partial Transactions using My Transactions and did not use a Census.
The Census grids displays the transactions recorded.
We ran a Detailed Inventory Report for 1 February 2018 to 8 October 2018:
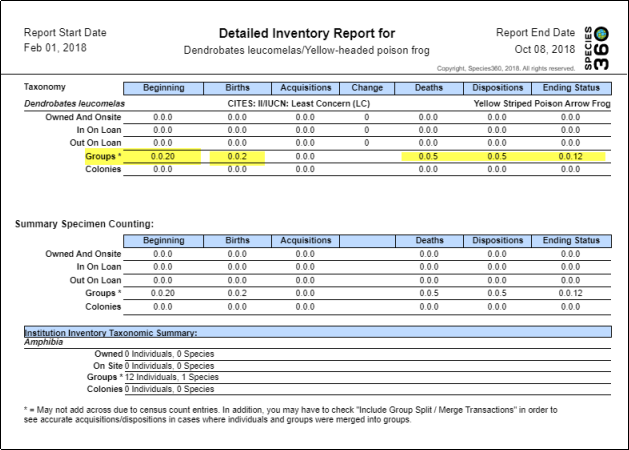
Because all the count changes were entered as Partial Transactions, the numbers across add up.
CENSUS AND PARTIAL TRANSACTIONS MIX
This method of tracking the numbers in your Group uses both recording a Census and recording Partial Transactions. Perhaps your policy is to record a census every few months and also track known transactions such as Births or Deaths in between. What displays in the Census grid is a combination of transactions and census counts:
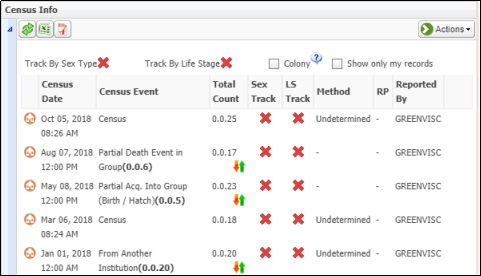
We ran a Detailed Inventory Report for 1 February 2018 to 8 October 2018:
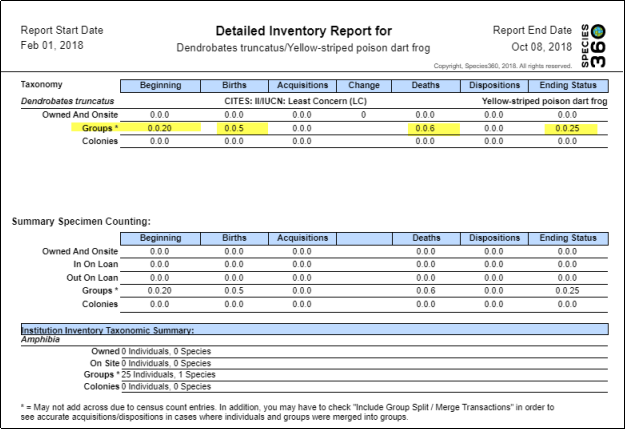
The Births and Deaths recorded as Partial Transactions display. The Census Counts do not display. Therefore, the row does not add up across as the Ending Status is either the most recent Census taken, or the count after the most recent Partial Transaction. This is correct.
RECOMMENDATIONS
If you do not care about an Inventory Report adding correctly across and only want to track numbers at a specified time, use the Census Count.
If you want the Inventory Report to add up across the line use Partial Transactions. If the reason for the increase in numbers is known, such as Births, record as such. If it is not known, select a Partial Acquisition of Undetermined/Indeterminate. If the reason for the decrease in numbers is known, such as Deaths, record as such. If the reason is not known, select a Partial Disposition of Undetermined/Indeterminate.
If you want to use a mix of the two methods be aware that your Inventory Report will not add up across the row should you need to explain why to a Staff member or inspector.
Back to Topics Covered
Inventory Summary Report
This Report details the starting and ending counts of a Species during a selected Date Range. Physically held and Legally owned must be run as separate reports. Columns indicate the ins and outs at your Institution.
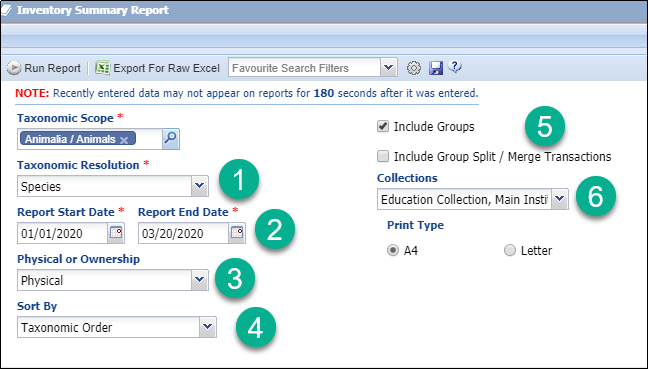
1.The Taxonomic Resolution can be from Kingdom to Breed and below. If you have domestics, you want displayed as such you will need to select a resolution of Breed.
2.The default Date Range is the first of the year to today but can be edited.
3.You must select Physical or Ownership. Physical will return all animals physically at your facility regardless of Ownership. Ownership will return all animal you own regardless of where they are physically held.
4.You can sort the report by the Taxonomic Tree or by Scientific Name alphabetically.
5.Groups are included by default but can be excluded. If you want to display Splits and Merges in your Groups you will need to check that box. Splits and Merges are commonly not included as they often do not reflect changing numbers in your collection.
6.All Collections are included by default but can be removed if desired.
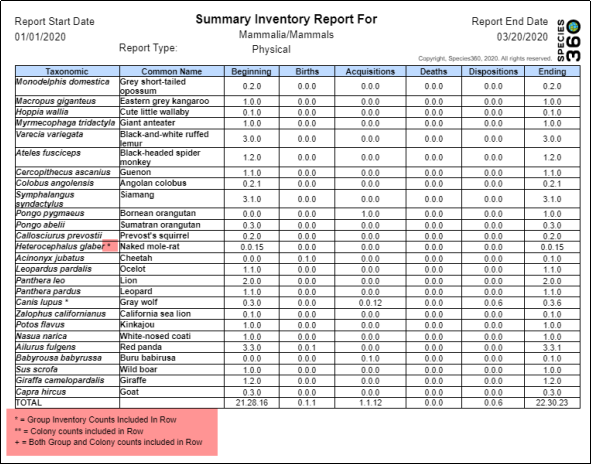
The Report above was run for Mammals physically held at our facility. Note that Groups/Colonies do not have their own line but are indicated by an asterisk or plus sign to the right of the Taxonomic Name. If you have used a Census count to change the numbers in your Groups, the line may not add up across. See Impact of Group Census Versus Group Partial Transactions for more information.
Back to Topics Covered
Multi Facility Inventory report
This report can only be accessed when logged in through a parent organization or association. It allows the parent organization or association to run inventory summary reports for any of the child facilities in one report.
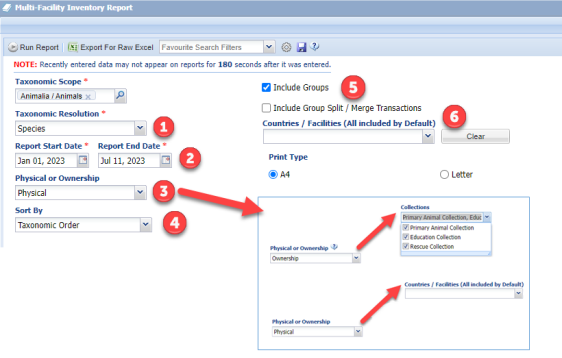
1.The Taxonomic Resolution can be from Kingdom to Breed and below. If you want to display domestics separately, you will need to select a resolution of Breed.
2.The default Date Range is the first of the year to today but can be edited.
3.You must select Physical or Ownership.
- Physical will return all animals that are physically held at your child institutions regardless of Ownership.
- When Ownership is selected the Countries/Facilities dropdown will revert to Collections dropdown. Ownership will return all animals the parent institution owns regardless of where they are physically held.
4.You can sort the report by the Taxonomic Tree or by Scientific Name alphabetically.
5.Groups are included by default but can be excluded. If you want to display Splits and Merges in your Groups you will need to check that box. Splits and Merges are commonly not included as they often do not reflect changing numbers in your collection.
6. When running the report for Physical all Countries/Facilities are included by default but can be removed if desired through the dropdown. When running for Ownership all collections are included by default but can be removed if desired through the dropdown.
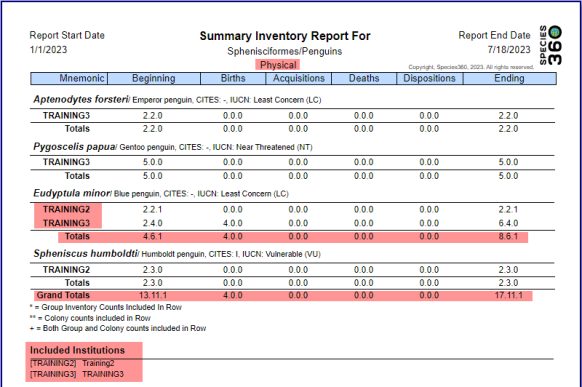
The report above was run for two child institutions for ‘Sphenisciformes’ that were physically held. If a species is held at both institutions then two lines will display with a Totals line beneath. The Grand Totals line at the end of the report is the sum of all institution's animals included in the report.
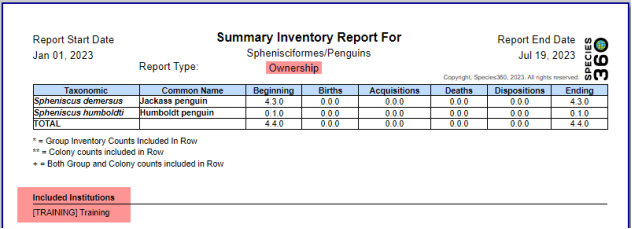
The report above was run for Ownership for ‘Sphenisciformes’. As it was run for ownership for the parent institution, it will show any animals owned by the parent organization/association regardless of where they are physically held at child institutions/facilities, and as such will not distinguish by presenting in separate lines.
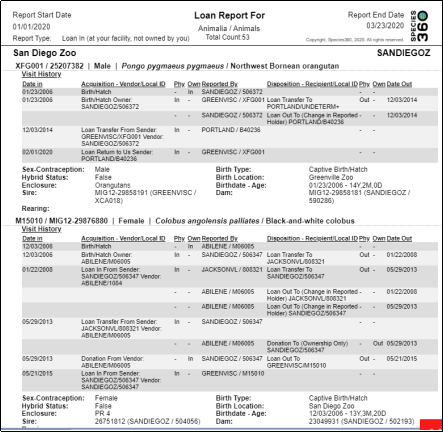
Loan Report
This Report displays animals that either In-On-Loan at your facility (not owned by you but physically held) or Out-On-Loan at another facility (owned by you but not held by you).
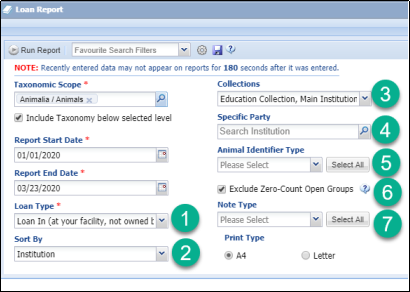
Some things to note about this Report:
1.You must select either Loan In or Loan Out.
2.You can sort the Report by Institution, Taxonomy or Local ID.
3.All Collections are included by default but can be edited.
4.You can filter the Report by a specific Institution, but only one facility per Report.
5.Adding Identifiers can help you better know what animal it is. Local ID is displayed by default.
6.Zero-count open groups are not included by default.
7.Including Note Types is helpful especially if you take note of when loan updates are sent or received using a Note.
Below is a Loan Report for animals In-On-Loan:
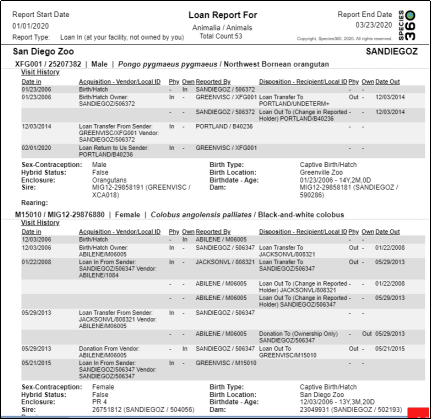
Below is a Report for animals Out-On-Loan.
Back to Topics Covered
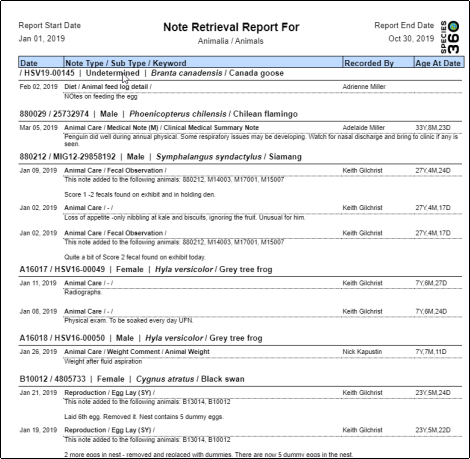
Note Retrieval Report
Use this Report to find a specific Keyword, word or text string in a Note or Observation. It can be searched by Animal or Enclosure.
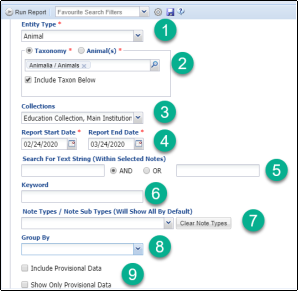
1.You can select Animal or Enclosure as the Entity Type
2.What you select for Entity Type will drive your choices here
- If you selected Animals above, you can search by Taxonomy or one or more animals. You cannot use Animal Lists.
- If you selected Enclosures above, you can search by one enclosure. You cannot use Enclosure Lists.
3.All collections are included by default but can be edited
4.Select the desired Date Range
5.Enter the Text you are looking for in these free text fields. If AND is selected ZIMS will find Text that matches both entries. If OR is selected ZIMS will find the Text for either or both entries. Partial entries will be found. For example, if you enter “ear”, ZIMS will also find “rear”.
6.You can search by Keyword
7.This is a multiple select cascading dropdown list that allows you to select at the Note Type level or down to specific Note Sub Types. At the bottom of the list of note types you will see the option to 'include obsolete records' to search for note types that are no longer active in ZIMS.
8.You can select how to Group the Report by Taxonomy, Local DI, GAN, Note Date and Note Type.
9.You have the option to include Provisional Data or display only Provisional Data.
The Report below is grouped by Local ID.
Back to Topics Covered
Peak Holding Report
This Report displays the highest number of a species held during a specified Date Range. In the United States this Report is often used to answer year-end reporting questions for USDA license.
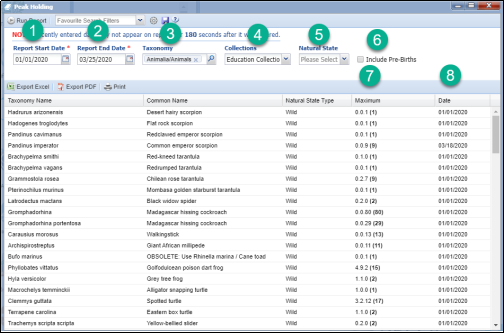
This Report does not have a collapsible filter grid; the Report displays directly below your filters.
1.The default Report Start Date is blank.
2.The default Report End Date is today.
3.Select the Taxonomy you want.
4.All Collections are included by default but can be edited
5.You can filter by Domestic or Wild. If left blank both will be displayed in the Report.
6.If you want to include fetuses and eggs, check this box.
7.The highest number of the species during the selected Date Range displays in this column.
8.The first date that the highest number was reached displays in this column.
Back to Topics Covered
Species Event History
This is not really a Report but is an active visualization of Births/Hatches, Wild Captures and Moves.
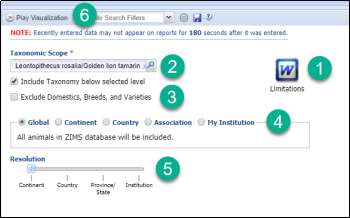
1.Be sure to read the Limitations document so you understand why some data is not included in the visualization.
2.The Taxonomy must be at the Species or below.
3.You can opt to exclude Domestics, Breeds and Varieties.
4.You can select a scope of Global down to My Institution.
5.What you select for the scope above will influence what options you have for the Resolution.
6.When you are ready select Play Visualization.
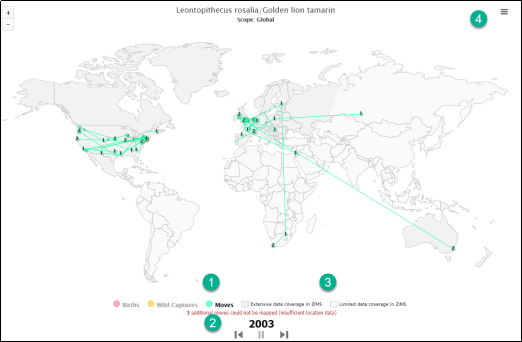
1.What is displayed on the screen is color coded. Here we are looking at Moves.
2.The year displays. You can go forward or backward using the left and right arrows.
3.The darker shaded areas of the Global map indicate extensive data coverage in ZIMS, the lighter areas indicate more limited data coverage in ZIMS.
4.You can download the graph to various formats using the hamburger icon.
Back to Topics Covered
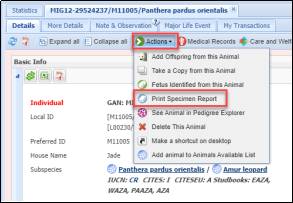
Specimen Report
A Report of a single individual or group record.
In addition to running a Specimen Report from the Start menu, you can run this Report from within the record under Details tab > Actions > Print Specimen Report.
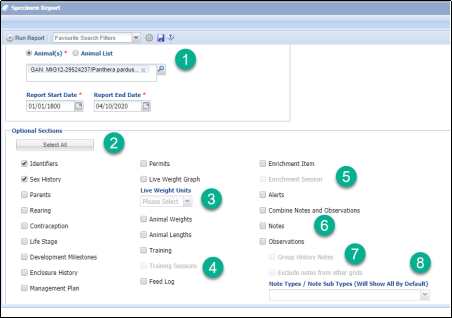
1.You can select a single animal or multiple animals or you can run the Report for all animals in an Animal List.
2.Identifiers and Sex History are checked by default. To check all the options, choose Select All.
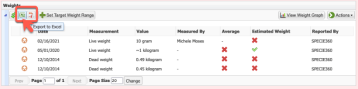
3.Live Weight Units is activated only if Live Weight Graph is checked.
4.Training Sessions is activated only if Training is checked.
5.Enrichment Session is activated only if Enrichment Item is checked.
6,There are three options for how you want Notes and Observations to display.
- Combine Notes and Observations – they will be displayed together in chronological order. If this is checked the following options are not available.
- Notes – Notes will display in their separate list. If this is checked Combine Notes and Observations is not available.
- Observations – Observations will display in their separate list. If this is checked Combine Notes and Observations is not available.
7.Group History Notes and Exclude notes from other grids are activated only if Notes is checked.
8.All Note Types and Sub Types will display by default. To filter to specific ones, select them here.
Below is an example of a Specimen Report.
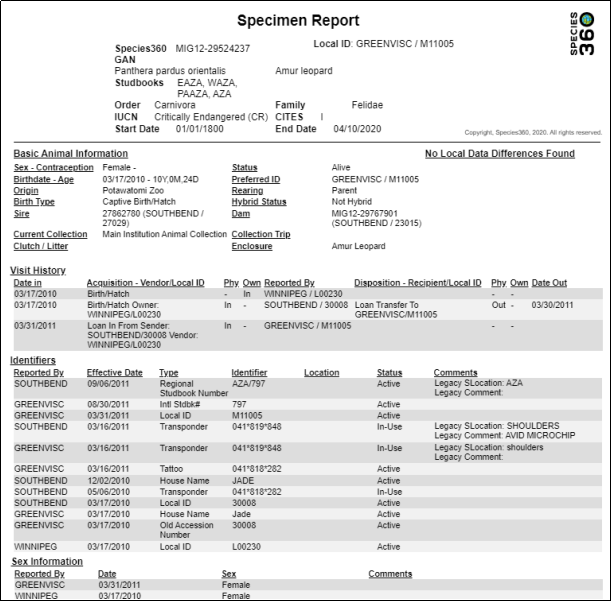
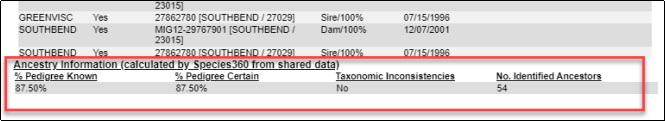
The last grid in the Report displays Ancestry Information. Parents must be selected as a filter in order for this to show.
When there is a Taxonomic Inconsistency in the pedigree for the animal in your report, the output will display the taxonomy in red:
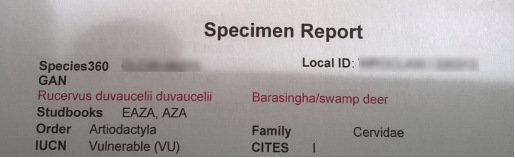
If the parental taxonomy of the selected animal differs, especially if the parents are not at the same holder, this can be difficult to determine. Using the pedigree explorer and taxonomic inconsistency tools can help identify the conflict.
Back to Topics Covered
Taxon Report
A Report for a single taxon, often including the taxon below the specified taxon.
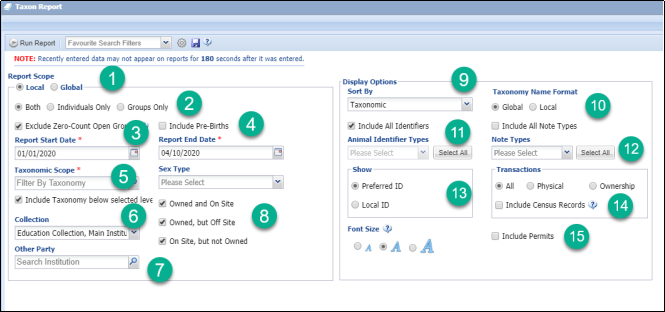
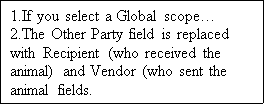
1.This is one of the few reports that you can run at the Local or Global level.
2.Running the Report for both Individuals and Groups is the default, but you can select to run for one or the other.
3.By default zero-count group records will be included, uncheck this if you don’t want to see them.
4.Check this box if you want to include fetuses or eggs.
5.Including Taxonomy below the select taxa is checked by default.
6.All Collections are included by default but they can be unchecked.
7.Other Party displays only when Local scope is selected. This will filter the Report to include only the institution recorded here.
8.All physical and ownership options are checked by default but can be unchecked.
9.You can select to sort the Report by Taxonomy, GAN, Local/Preferred ID or Birth Date.
10.You can select to show the Global or the Local taxonomy name.
11.All Identifiers are included by default but you can uncheck this box and select specific ones.
12.You can select to include some or all Notes and Observations.
13.Displaying the Preferred ID is checked by default.
14.All transactions are included by default but you can filter the Report by Physical or Ownership.
15.Permit information can also be included in the Report.
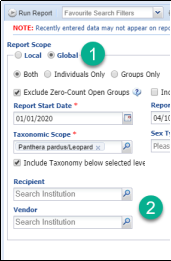
Below is an example of a Taxon Report. The number of animals in the Report displays at the bottom next to the Print button.
Back to Topics Covered
Transaction Report
Acquisitions and Dispositions (including Birth/Hatches and Deaths) over a specified date range.
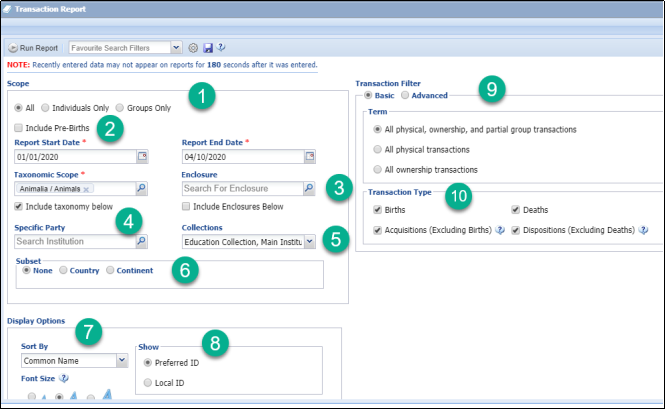
1.Both individuals and groups are included by default but you can filter by one or the other.
2.Fetuses and eggs are excluded by default but can be added.
3.You can select transactions for a specific Enclosure, but only one.
4.You can filter by transactions with a specific institution.
5.All Collections are included by default but can be filtered.
6.No scope is selected by default but you can select to view only transactions with a specific Country or Continent.
7.You can sort the Report by GAN, Local ID/Preferred ID, Transaction Type, Taxonomy, Common Name, Date and Other Party.
8.You can select to show the Preferred ID (default) or the Local ID.
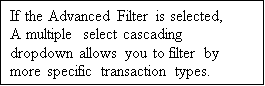
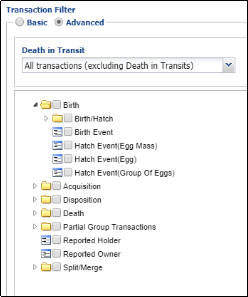
9.Basic Filter is the default and it includes all variations for the selected transaction Terms. See below for Advanced Filter.
10.All are checked by default but you can filter by Transaction Types.
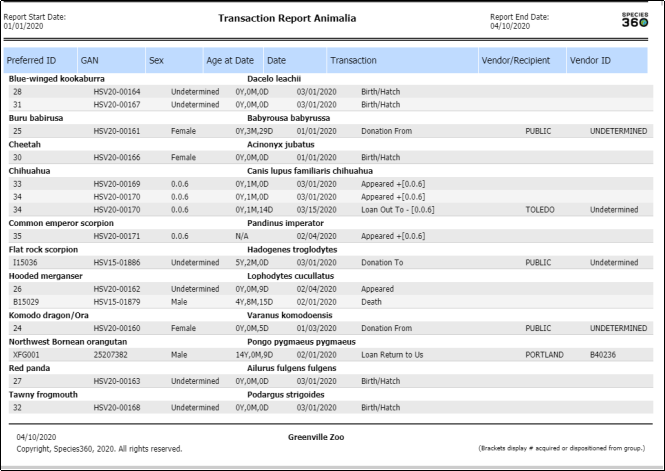
Below is an example of a Transaction Report.
Back to Topics Covered
Wild Acquisitions Report
This Report captures all animals Collected From Wild during a specified date range.
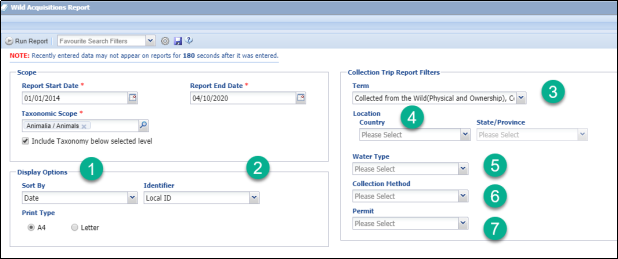
1.The Report can be sorted by Collection Method, Common Name, Date, Location (capture), Permit, Staff, Taxonomy and Water Type.
2.You can select to display the GAN, Local ID or Preferred ID
3.All variations of Collected From Wild are checked by default but these can be further filtered.
4.You can run the Report for a specified Location.
5.The Water Type is a multiple select dropdown of water types.
6.The Collection Method is a multiple select dropdown.
7.The Permit selection is a multiple select dropdown sourced from your Permit list in My Institution.
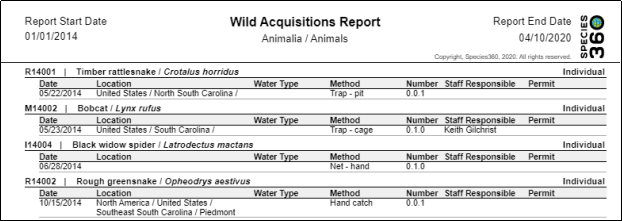
Below is an example of a Wild Acquisitions Report.
Back to Topics Covered
Revised 5 March 2025