


Taxon Profiles – Weights Dashboard
The Weights Dashboard appears as a tab in addition to a separate analysis for reproduction under the
Taxon Profiles feature
.
This tab contains a single plot called Body weight pattern, that displays mean body weight as a line, and a shaded area to represent one standard deviation above and below the mean growth curve by age range. There is a filter to view data based on sex type. All data included in the weight reports are Species360 records extracted from ZIMS for Husbandry.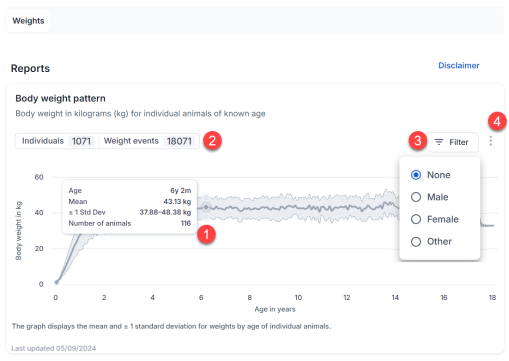
- Hover over any point on the graph to view more information for a particular age class.
- View the number of individuals and separate weight events that contributed to this weight graph.
- Use the filter button to see weights for different sex types, if available.
-
Click this icon
 to open a menu for exporting the graph.
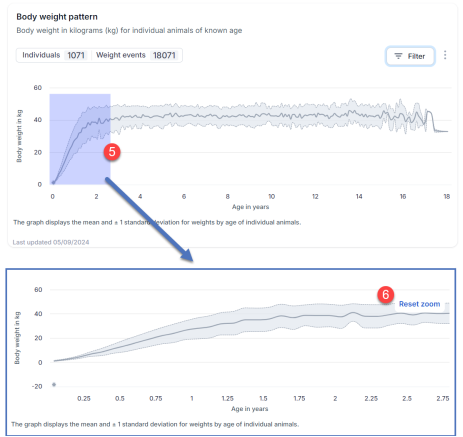
- Highlight an area on the graph to zoom into an age range. The first weeks of life are summarized in days instead of months. This provides greater granularity as animals are rapidly growing. Details for each data range are provided in the hover over label for clarity.
- Use the reset zoom button to return to the full graph.
Additionally, when your institution holds the specific taxa, you will have the option to search your holding and select an individual to overlay over the global averages.
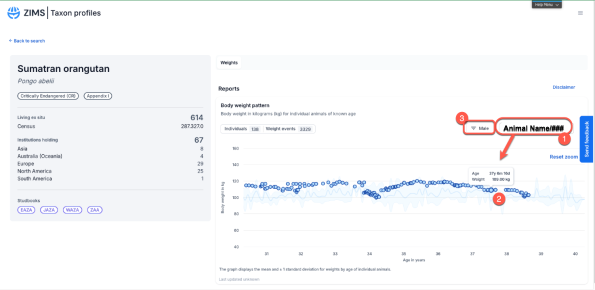
- Enter the ID of an individual from your collection
- Individual weight data points are overlaid on the graph below
-
Filtering by sex option available
Overlay the institutional weight business rules:
- Search is limited to 50 current results, will include historical collection data if less than 50 current results are present).
- Animal comparison requires that user has permissions to weight records.
- User will only view local weights in this overlay, weights entered by other institutions may be included in the future.
- Local weights are not curated, therefore estimates, outliers, etc. will all be visible.
- Results are restricted to individuals of the taxon being viewed (and below)
- The institution weight values will display on the graph based on the animal age as of the date their weight was measured, generating a scatterplot for each animal.
- The weight value and age for each point displays on the graph
- If the animal's DOB or date weight measured is an estimate, a “~” displays before the age in the hover-over
- If the weight value is an estimate, a “~” displays before the weight value in the hover-over
Revised 2 February 2026