


Taxon Profiles – Reproduction Dashboard
The Reproduction Dashboard appears as a tab in addition to a separate analysis for global weights under the Taxon Profiles feature . This tool provides a comprehensive view of reproductive data for a specific taxon. The Reproduction Dashboard displays analytical information about various species-level reproductive statistics, including age of reproduction, litter size, and seasonality.
The Reproduction Dashboard uses a curated dataset of ZIMS for Husbandry data to provide the most accurate statistics possible. The Reproduction Dashboard analyses are based around reproductive events, and the dataset is processed using strict data exclusion, anonymization, and transformation methods to ensure the accuracy of these species-level analytics. Read more about the
curation of this data here
.
Key Data Insights
The dashboard translates complex global datasets into actionable insights. Click the links below to learn more about the different areas of the report, how to filter the data, and how the data was curated.
- Report navigation : Navigate through the report, know when the data was last updated, and filter the report
- Filters : Allows users to filter the dashboard based on different criteria, such as location of event, date, and taxonomy. Users can also include/exclude different pre-defined parameters.
- Data overview : Provides a high-level summary of curated samples, including reproductive events, number of offspring, and a map of breeding institutions.
- Age summary : Displays mean, median, youngest, and oldest ages of reproduction for both males and females. It specifically highlights the 5% and 95% benchmarks to indicate when a species is most likely to start and end its reproductive life stage.
- Litter/clutch size : Shows the frequency and distribution of offspring per reproductive event, assisting in facility planning and resource allocation.
- Seasonality: Illustrates birth distribution across the year, filtered by Northern or Southern Hemispheres.
- About the data : information about the data transformations and exclusions/inclusions criteria in effect.
Report navigation
At the top of the report is the report header.
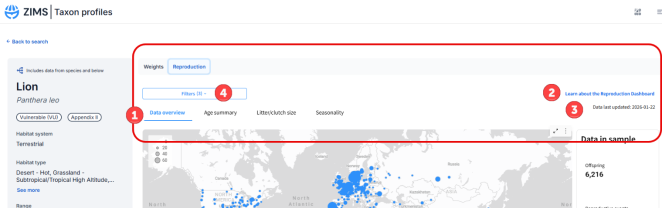
- Navigation tabs: Navigate to the different pages within the report
- Learn more link: Follow the link to this help document to learn more about the analytics
- Data last updated: See when the data was last updated
- Filters: Open the filter window to filter the data within the report. You can also see how many filters are currently applied to the data
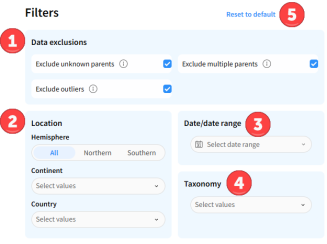
Filters
Click the filters button to open the filters window. The filters will filter the data supplying the report, and will filter across all pages of the report.
-
Data exclusions: The dashboard loads with three data exclusions already applied to maximize the quality of the results. You can choose to include/exclude any of these three data types by checking/unchecking the box
- Exclude unknown parents – removes data points where parents have been recorded as unknown, wild, not-in-ZIMS
- Exclude multiple parents - removes data points where more than one dam or more than one sire has been recorded
- Exclude outliers – removes data points that have been marked as outliers using the Tukey method
- Location: Filter the data based on geographical information such as Hemisphere, Continent, and Country
- Date: Filter the data based on the date of the reproductive event. Here you can also use qualifiers such as “before”, “after” and “last” (e.g. last 5 years)
- Taxonomy: Filter the data based on taxonomy. E.g., for reports which include species and subspecies, you can choose to limit the data to a specific subspecies or to only animals recorded at the species level
- Reset to default: Click at any time to reset the filters back to their original settings
Data Overview
This tab provides a high-level summary of the data sample, including location.
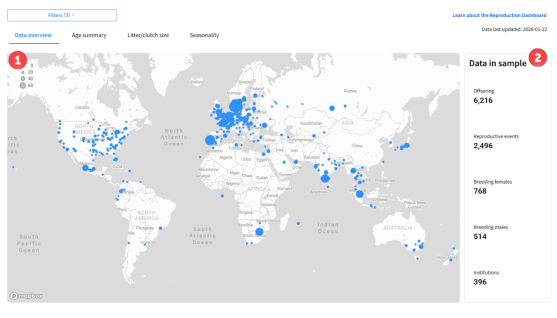
- Global Distribution Map: Visualizes the locations of where reproductive events took place, and how many occurred.
-
Overview Cards: Displays key statistics for the sample data, including:
- Offspring in sample: Total number of offspring produced in the included reproductive events (value from the offspring dataset ).
- Reproductive events in sample: Total count of breeding events (value from the offspring dataset )..
- Breeding females/males in sample: Counts of unique individuals in the sample that produced offspring (value from the parent dataset - note - not all reproductive events will have complete parent data, and this value may show as null even if there are reproductive events) .
- Breeding institutions in sample: Number of institutions where reproductive events took place(value from the offspring dataset )..
Age Summary
This tab displays different metrics for the Age of reproduction (age at which parents reproduce), and Age of first reproduction (age at which parents produce their first offspring). Data note:
Data note
- The data used for the analysis on this tab is from the parent perspective. Reproductive events are calculated for every parent to calculate the age of the parent at each event. By default, multiple parents, unknown parents, and outliers are excluded, but can be included in the
filters
.
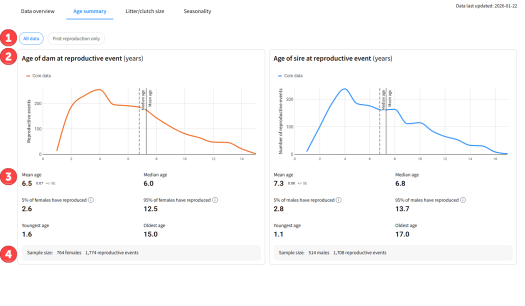
- Toggle Views: Use the toggles to switch between viewing All data or First reproduction only.
-
Age at reproduction graphs: See how many reproductive events occur at each age for dams and for sires.
- Graphs will display a solid line for where the mean falls, and a dashed line for where the median falls
-
Statistics: Different metrics for the age at which a parent reproduces. These metrics are calculated for females and males, and are calculated for all events or only first events depending on the toggle. Metrics include:
- Mean: average age at which a parent reproduces
- Median: midpoint age at which a parent reproduces
- 5% of [sex] have reproduced: age at which 5% of the sample have reproduced (0.05 percentile)
- 95% of [sex] have reproduced: age at which 95% of the sample have reproduced (0.95 percentile)
- Youngest : minimum age at which a parent has reproduced
- Oldest : maximum age at which a parent has reproduced
- Sample size: See the number of dams/sires and number of reproductive events that are included in the analysis.
Litter / Clutch Size
This tab displays a graph that shows the proportion of times a specific number of offspring was born/hatched per reproductive event, as well as the mean and median number of offspring per litter/clutch.
Data note - The data used for the analysis on this tab is from the offspring’s perspective, and reproductive events are calculated for the entire parent combination. By default, multiple parents, unknown parents, and outliers are excluded, but can be included in the filters .
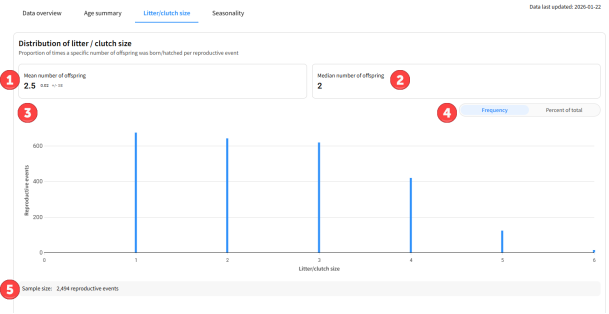
- Mean: Shows the mean number of offspring within each reproductive event, including the standard error
- Median: Shows the median number of offspring per reproductive event.
- Litter/clutch size graph: Shows how many times a reproductive event has occurred with each number of offspring.
- Frequency/percent of total toggle: Change the Y axis of the graph to show either number of events or frequency (%) of events (note – this toggle will also affect the Seasonality graph)
- Sample size: See how many reproductive events were included in the analysis.
Seasonality
This tab displays a graph that shows the proportion of births occurring per month in institutions located in the chosen hemisphere, as well as the total number of reproductive events in each hemisphere. Use the legend on the graph, or the filters, to narrow down the dataset to a specific hemisphere, or view all of the data together.
Data note –
The data used for the analysis on this tab is from the offspring perspective, and reproductive events are calculated for the entire parent combination. By default, multiple parents, unknown parents, and outliers are excluded, but can be included in the filters .
The reproductive event date is defined as the first date of birth of any offspring within the reproductive event. The reproductive event date is used to calculate seasonality and even if the reproductive event spans different months, the analysis will use the first month within the reproductive event
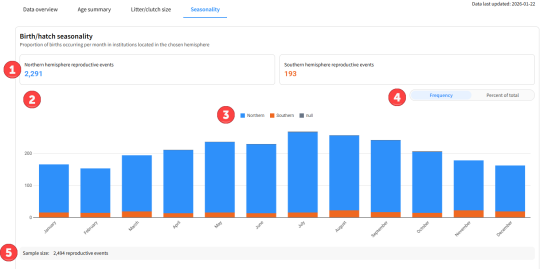
- Overview Cards: See the total number of reproductive events in the sample for the Northern and Southern hemispheres.
- Seasonality graph: See the month when reproductive events took place.
- Legend: Use the legend to show just Northern or just Southern, or remove null values.
- Frequency/percent of total toggle: Change the Y axis of the graph to show either number of events or frequency (%) of events (note – this toggle will also affect the Litter/clutch size graph)
- Sample size: See how many reproductive events were included in the analysis.
About the data
Analysis update/data currentness:
The data in this report is updated weekly on Friday. Any new data recorded in ZIMS will be included automatically if it meets the data criteria below. The date last updated can be found on the top right corner of the report.
Data Rules for the Reproduction Dashboard Curated Dataset
Data source:
- The Reproduction dataset only uses data entered in ZIMS for Husbandry. Studbook and Medical data are not currently included.
- If viewing the Reproduction Dashboard for a species, the dataset will automatically include any sub-species and below data in the analysis. Viewing a sub-species will include only data for that sub-species.
Data inclusions:
To be included in the curated dataset, data must meet the following criteria:
- Offspring birth date must be on or after 1 January 1990
- Offspring birth date must not be an estimate
- Record type must be an individual (groups, incomplete accessions, colonies, eggs and fetus’ excluded)
- Must have been consistently in a global collection (never in a private collection)
- Taxonomy must be recorded at species level or below
- Birth date for offspring must not be before parent birth date
- Parent death date must not be before offspring birth date
- Birth date must be before death date
- Animal is born ex situ
Data Transformation
To create the Reproduction dataset, individual birth events have been transformed into reproductive events. Reproductive events are calculated based on the following criteria:
- Offspring are born/hatched at the same institution as each other
- Offspring have the same recorded parents
-
The interval between births/hatches is no more than:
- 3 days for live bearing species
- 7 days for egg laying species
- For Litter/clutch size and Seasonality , reproductive events are calculated from an offspring perspective, and include the full combination of parents as a single reproductive event
- For Age statistics, reproductive events are calculated from each parent's perspective, and repeated for each individual parent of the offspring
- The reproductive event date is calculated from the first date of birth of the offspring included in the reproductive event.
Practical Applications [JC1]
Institutions can leverage this data to enhance animal husbandry and welfare:
- Care Planning: Identify the exact age to implement breeding exams or transition animals to reproductive diets.
- Population Management: Determine optimal timing for contraception or when to separate animals from neonatal groups.
- Resource Preparation: Use litter/clutch size data to prepare hand-rearing scenarios or future placement needs.
- Expectation Management: Level-set staff expectations for breeding success and prepare for life-stage-specific enrichment or enclosure requirements.
Revised 2 February 2026