


Reproductive Tool
The Reproductive Dashboard is available in ZIMS for studbooks and provides summary reproductive information for your studbook. Video overviews are available for the
Reproductive Dashboard
and
Lists of Breeders
.
Topics
|
Reproductive Age Summary Graph, and List of Reproductive Events |
|
Litter/Clutch Summary Graph, Seasonlity Graph, and List of Reproductive Events |
Granting access to the Reproductive Tool
Access to the Reproductive Dashboard is given by the Studbook Admin through Role Management . If the “Search/View” box is checked, then users will have full access to the Reproductive Dashboard. If the “Search/View” box is not checked, then the user will not see the Reproductive Dashboard.
Back to Topics
Where to find the Reproductive Tool
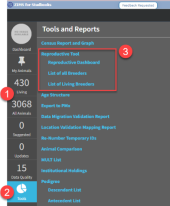
Within your studbook, the Reproductive Tool can be found under the tools menu in the left had navigation on the animal lists.
To open the Reproductive Dashboard, open your studbook then click on your preferred animal list (All or Living lists) (1), click Tools (2), then click Reproductive Dashboard (3).
Back to Topics
Reproductive Dashboard
The Reproductive Dashboard provides a Reproductive Age Summary, and Littler/Clutch Summary for your studbook. The information is visualized in both summaries, with a list underneath of the events that are included in the summaries. The Reproductive Dashboard will show by default the Reproductive Age Summary and associated list of Reproductive Events.
Reproductive Age Summary Graph and List of Reproductive Events
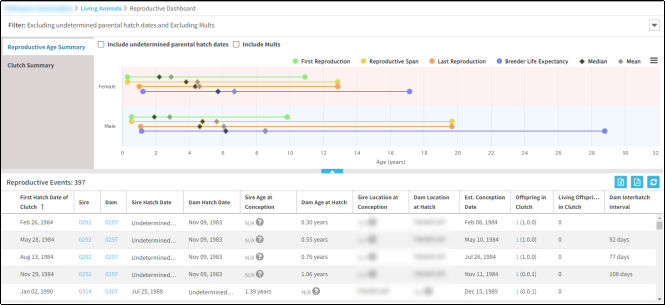
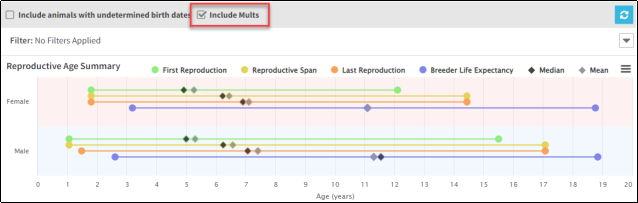
The Reproductive Age Summary graph displays as default and provides summary reproductive event information for males and females within your studbook population, with selected filters. The Reproductive Event List displays detailed information for each reproductive event that is included in the graph.
- The graph displays statistical information for the population, including First Reproduction , Last Reproduction , Reproductive Span and Breeder Life Expectancy . The graph also displays Mean and Median values for each category and the total number of animals included in the analysis of each category.
Click and drag an area to zoom in.
- The Reproductive Events list displays all of the reproductive events which are included in the analysis.
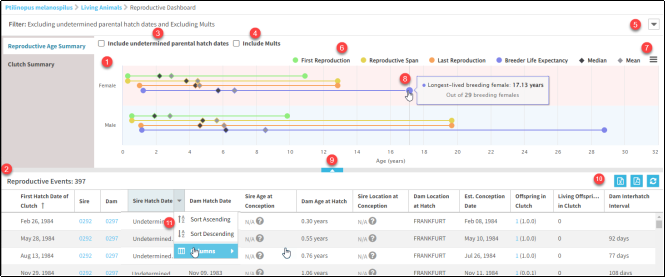
- Choose to include (checked) or exclude (unchecked) reproductive events with undetermined parental birth/hatch dates .
- Choose to include (checked) or exclude (unchecked) reproductive events which were recorded with MULT parent s.
- Choose to filter both summaries further by Institution , Date , Taxonomy and UDF by clicking on the Filter drop down (this will also filter the Litter/Clutch Summary).
- Toggle different analyses off and on by clicking on category in the legend.
- Export the graph by clicking on the three horizontal lines to bring up the export menu.
- Hover over any data point to see a summary of the data. Click on an endpoint, mean or median (for any category except Breeder Life Expectancy) to filter the List of Reproductive Events below the graph with the events for that data point. (Clicking Show Full List will return to users back to the full list). Breeder Life Expectancy is not calculated using the reproductive events, when users select the endpoints, mean or median on Breeder Life Expectancy, users will navigate to a list of the animals included in analysis. Click on the breadcrumb at the top of the screen to navigate back to the dashboard.
- Show/hide the graphs by clicking on the blue arrow.
- Export the Reproductive Events list to Excel, PDF or refresh the list.
- Sort and customize your columns (more information on the columns here ).
Back to Topics
Statistical Information
First Reproduction
The First Reproduction line displays the age range of animals within the population that have reproduced for the first time. The endpoints on the graph display the youngest age at first reproduction and the oldest age at first reproduction. Any animals recorded producing offspring on or before their own date of birth/hatch are excluded from the analysis.
If there has been no breeding in the population or within the selected filters, this value will not display.
Last Reproduction
The Last Reproduction line displays the age range of the last reproductive events for animals that have produced offspring in the population. The endpoints on the graph display the youngest animal at their last reproduction event and the oldest animal at their last reproduction event. Only dead animals are included in this analysis, except for the oldest last reproduction value, since a living animal may have a reproductive age after the dead animals. Any animals recorded producing offspring on or before their own date of birth/hatch are excluded from the analysis.
If there are no breeding animals which have died within the population or selected filters, this value will not display.
Reproductive Span
The Reproductive Span line displays the age range of reproduction for the population. It uses all reproductive events that have happened within the population to display the full potential breeding age for the population. The endpoints on the graph display the youngest and oldest animals to produce offspring. Any animals recorded producing offspring on or before their own date of birth/hatch are excluded from the analysis.
If there has been no breeding in the population or selected filters, this value will not display.
Breeder Life Expectancy
The Breeder Life Expectance line displays the life expectancy for animals in the population that have produced offspring. Only dead animals are included in the analysis, unless the oldest animal is still living then the oldest living breeding animal will display. Only animals which have produced at least one offspring are included in this analysis, animals which have not produced offspring are excluded. The endpoints on the graph represent the age at death for the youngest breeder in the population, and the oldest breeder’s age at death. Any animals recorded producing offspring on or before their own date of birth/hatch are excluded from the analysis.
If there have been no breeding animals that have died within the population or selected filters, this value will not display.
Back to Topics
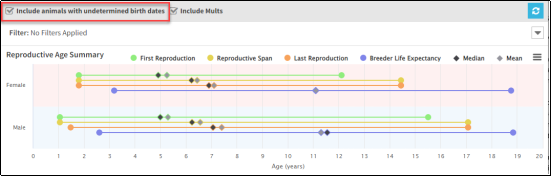
Include/exclude animals with undetermined birth dates
Animals with undetermined birth dates are excluded from the graph by default. Users can choose to include them into the analysis by selecting the checkbox at the top of the report. The system uses the date entered as the birth date to include undetermined birth date animal’s reproduction events into the analysis.
When the include/exclude undetermined birth dates box is unchecked and a reproductive event includes one parent that has an undetermined birth date and the other does not, the reproductive event will be included in the reproductive event list and the event will be included in the graph calculations for the parent that does not have an undetermined birth date estimate.
When the include/exclude undetermined birth dates box is checked and a reproductive event includes one parent that has an undetermined birth date and the other does not, both parents will be included in the reproductive graph calculations.
When the include/exclude undetermined birth dates box is checked, any reproductive events that have both parents with undetermined birth dates will be included in the analysis.
Include/exclude MULTs
Animals that are listed in a MULT grouping that has bred are by default excluded from analysis. If an animal is listed in a MULT grouping and also as an individual parent, the information from the reproduction when the animal is listed as a single parent is included in analysis, but the MULT reproduction event is not included.
Users can choose to include MULTs into the analysis by selecting the checkbox at the top of the report. The system then includes any MULT grouping’s reproductive events into the analysis.
When the include/exclude MULT box is unchecked and a reproductive event includes one parent that is a MULT and the other is not, the reproductive event will be included in the reproductive event list and the event will be included in the graph calculations for the parent that is not a MULT. All animals within the MULT grouping will be counted towards the calculations in the graph.
When the include/exclude MULT box is checked and a reproductive event includes one parent that is a MULT and the is not, both parents will be included in the reproductive graph calculations.
When the include/exclude MULT box is checked, any reproductive events that have both parents that are MULTs will be included in the analysis. All animals within the MULT grouping will be counted towards the calculations in the graph.
Litter/Clutch Summary Graph, Seasonality Graph, and List of Reproductive Events
The Litter/Clutch Summary will display as either Litter Summary or Clutch Summary depending on the taxonomy of your studbook and provides a summary of the number of animals in litters/clutches, and the number/proportion of births/hatches per month of the year, for your studbook population. The Reproductive Event List displays detailed information for each reproductive event that is included in the graph.
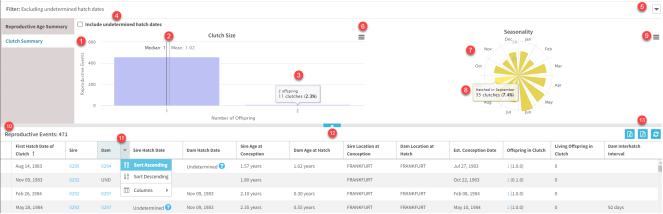
- The Clutch/Litter Size graphs the number of offspring per reproductive event (number of offspring in each litter/clutch). Click and drag an area to zoom in.
- The graph also displays the Mean and Median values.
- Hover over any bar to see a summary of the data.
- Choose to include (checked) or exclude (unchecked) offspring with undetermined hatch dates.
- Choose to filter both summaries further by Institution , Date , Taxonomy and UDF by clicking on the Filter drop down (this will also filter the Reproductive Age Summary).
- Export the Clutch/Litter Size graph by clicking on the three horizontal lines next to the graph to bring up the export menu.
- The Seasonality graph shows the population’s seasonality by month.
- Hover over any bar to see a summary of the data.
- Export the Seasonality graph by clicking on the three horizontal lines next to the graph to bring up the export menu.
- The Reproductive Events list gives you a total number of reproductive events included in the analysis, and details of each event.
- Sort and customize your columns (more information on the columns here ).
- Show/hide the graphs by clicking on the blue arrow.
- Export the Reproductive Events list to Excel, PDF or refresh the list.
Back to Topics
Reproductive Event List Columns:
First hatch date of litter/clutch
Date of birth/hatch for the first offspring in the litter/clutch.
Any date estimates associated with birth/hatch date will display. When opening this tool, the list default to sort by this column.
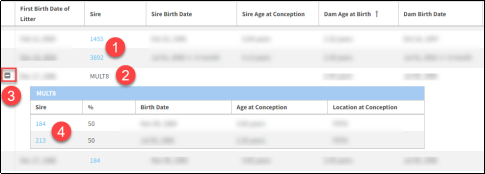
Sire
Sire of the litter/clutch.
Sire is a hyperlink if it is an individual animal (1). There is no hyperlink if the sire is MULT#, MULT, UND, UND #, WILD, or WILD# (2). Use the  and
and icons (3) to show and hide the potential sires within a MULT# (4).
If no sire is reported for the litter/clutch, then this column will be blank.
Sort by this column to see the reproductive events grouped by sire.
Dam
Dam of the litter/clutch.
As with
Sire
, Dam is a hyperlink if it is an individual animal, no hyperlink if MULT#, MULT, UND, UND #, WILD, or WILD#. Use the and icons to show and hide the potential dams within a MULT#.
If no dam is reported for the litter/clutch, then this column will be blank.
Sort by this column to see the reproductive events grouped by dam.
Sire Birth/Hatch Date
Birth/hatch date of the sire, will include any birth/hatch date estimates.
If the sire reported is a MULT#, MULT, UND, UND #, WILD, or WILD# the column will be blank. If no sire is reported for the litter/clutch, then this column will be blank.
Dam Birth/Hatch Date
Birth/hatch date of the dam, will include any birth/hatch date estimates.
If the dam reported is a MULT#, MULT, UND, UND #, WILD, or WILD# the column will be blank.
If no dam is reported for the litter/clutch, then this column will be blank.
Sire Age at Conception
Sire’s age on the offspring’s estimated conception date.
If the sire reported is a MULT#, MULT, UND, UND #, WILD, or WILD# the column will be blank.
This column will display ‘N/A’ if the reported sire has an undetermined birth/hatch date, and the user has not selected to include animals with undetermined birth/hatch dates.
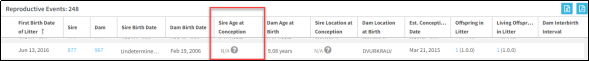
The N/A indicates that the information is not included in the analysis. To include the potential sire, the user can select to include animals with undetermined birth/hatch dates at the top of the screen. Sort by this column to view the youngest and oldest sires at conception.
Dam Age at Birth/Hatch
Dam’s age on the offspring’s birth/hatch date.
If the dam reported is a MULT#, MULT, UND, UND #, WILD, or WILD# the column will be blank.
This column will display ‘N/A’ if the reported dam has an undetermined birth/hatch date and the user has not selected to include animals with undetermined birth/hatch dates.
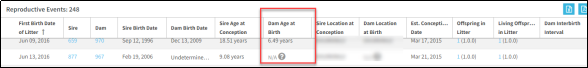
The N/A indicates that the information is not included in the analysis. To include the potential dams, the user can select to include animals with undetermined birth/hatch dates at the top of the screen. Sort by this column to view the youngest and oldest dams at birth/hatch.
Sire Location at Conception
Physical location of the sire on the estimated conception date.
If the sire reported is a MULT#, MULT, UND, UND #, WILD, or WILD# the column will be blank.
This column will display ‘N/A’ if the sire’s status was lost to follow-up, released, or dead on the date of conception. The N/A indicates that the status of the sire does not align with the conception date.
This column will also display ‘N/A’ if the location field is empty in the transaction grid.
Dam Location at Birth/Hatch
Physical location of the dam on the birth/hatch date.
If the dam reported is a MULT#, MULT, UND, UND #, WILD, or WILD# the column will be blank.
This column will display ‘N/A’ if the dam’s status was lost to follow-up, released, or dead on the date of conception. The N/A indicates that the status of the dam does not align with the conception date.
This column will also display ‘N/A’ if the location field is empty in the transaction grid.
Estimated conception date
Estimated conception date using the birth/hatch date of the first offspring in the litter.
Number of offspring in litter/clutch
Total number of offspring in the litter or clutch.
This is calculated using the maximum birth/hatch date range for litter/clutch mates set for that studbook. Any offspring born/hatched within that timeframe (days) from the same parents will be considered litter/clutch mates. Changing the maximum range could change the reproductive events within the list.
The hyperlinked number in this column takes users to the list of animals included in the litter.
Sort this column to view the largest and smallest litter sizes.
Number of living offspring in litter/clutch
Total number of living animals in each litter/clutch.
This is calculated using the maximum birth/hatch date range for litter/clutch mates. Any currently alive offspring which was born/hatched within the timeframe (days) from the same parents will be considered litter/clutch mates. Changing the maximum range could change the reproductive events within the list.
The hyperlinked number in this column takes user to the list of animal that are currently living in the litter.
Dam Interbirth/hatch Interval
The number of days between the litter in context and dam’s last litter.
If there is no previous litter (this is the dam’s first litter), then this column will be blank.
Sort this column to see the shortest or longest intervals.
Back to Topics
Reproductive Dashboard Filters
Institution Filter
Users have the option to apply an institution filter (institution, regional association, country, continent) to the Reproductive Age Summary graph and Reproductive Event List. If an institution filter is applied, the reproductive event or the death event must happen within the institution filter selected for the animal to be included in the analysis. By default, no institution filter is applied.
Date Filter
Users have the option to apply a date filter (as of end date or date range) to the Reproductive Age Summary graph. If a date filter is applied, the reproductive event or the death event must happen within the date range selected or on/after the end date selected for the animal to be included in the analysis. For females, the selected dates are applied to the birth/hatch date and for males the dates are applied to the estimated conception date. By default, no date filter is applied.
Taxonomy Filter
Users have the option to apply a taxonomy filter to the Reproductive Age Summary graph. If a taxonomy filter is applied, the reproductive event or the death event must happen for an animal whose current taxonomy matches the taxonomy selection.
UDF Filter
Users have the option to apply a UDF filter to the Reproductive Age Summary graph. If a UDF filter is applied, the reproductive event or the death event must happen for an animal that matches the UDF selection.
Back to Topics
List of All Breeders and List of Living Breeders
The list of All Breeding Animals and list of Living Breeding Animals can be accessed from the Tools menu under Reproductive Tools. Both lists provide individual level reproductive statistics for all males and females in the population that have produced offspring.
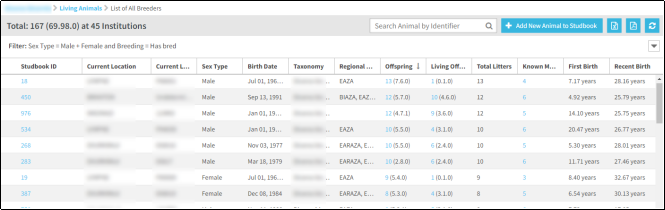
The List of All Breeders and List of Living Breeders have new columns included in the lists. These columns are available on other lists within your studbook, but these new lists have the ease of default filtering. Video Overview available here.
The List of All Breeders lists the animals in your studbook with a default filter of:
Sex Type = Male and Female
Breeding = Has Bred
The List of All Living Breeders lists the animals in your studbook with a default filter of:
Sex Type = Male and Female
Breeding = Has Bred
Status = Alive
Breeder List columns:
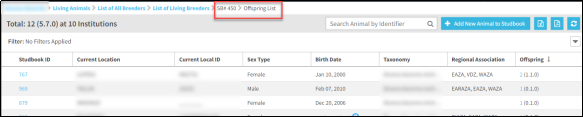
Offspring
Total number of offspring that have been produced by the animal. This column includes potential offspring e.g., if the sire or dam is included in a MULT grouping for the offspring.
The number in this column is a hyperlink that takes the user to a list of the animal’s offspring. The breadcrumbs at the top of the screen will help you see who’s offspring you are looking at and allow easy navigation back to the full list.
Total Litters/Clutches
Number of litters/clutches produced by the animal. The number in this column is not hyperlinked, but users can use the Offspring column to view a list of offspring within litters/clutches.
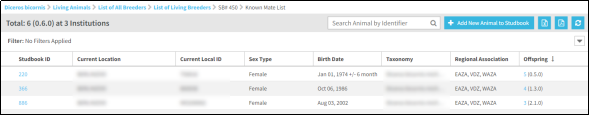
Known Mates
Number of mates the animal has successfully produced offspring with. Does not include UND, MULT, MULT#, or WILD mates in the count.
The number in this column is a hyperlink to a list of all the mates. Use the breadcrumbs at the top of the screen to return to the previous list of breeders.
First birth/estimated conception
Age of the animal at the first estimated conception (males) and first estimated birth/hatch (females). This number could display as negative if the offspring was born prior to the parent’s birthdate.
Last birth/estimated conception
Age of the animal at the time of the most recent estimated conception (males) and most recent birth/hatch date (females). This number could display as negative if the offspring was born prior to the parent’s birthdate.
Back to Topics
Frequently Asked Questions
Are contracepted animals included in the Reproductive Dashboard tool analyses?
Currently the contraception status of animals are included in the analyses but contraception is not considered. This means that permanently contracepted animals that are still living will still display in the calculation for breeder life expectancy even though they may not be part of the breeding population.
Which animals are excluded from the Reproductive Dashboard tool analyses?
The following animals are excluded:
- Draft animals
- Animals with parents of the incorrect sex (sire is female or dam is male)
- Animals who are born/hatched prior to their parents
- Animals with undetermined birth dates (can be included by using the checkbox at the top of the screen)
- Animals with a MULT parent (can be included by using the checkbox at the top of the screen
Why does my graph not display all the reproductive variables?
Most graphs will display four lines in each the female and male section: first reproduction, last reproduction, reproductive span, and breeder life expectancy.
In some populations, the reproductive data is not robust enough to present data for all the reproductive statistics to display.
For example, if none of the breeding animals have died then the last reproduction and breeder life expectancy lines will not display since these lines only include breeding animals that have died. If the population you are looking at has not had any breeding, then the graph will display as blank.
The Litter/Clutch size tool displays all reproductive events in the graph and list except for ones that include offspring with undetermined birth dates.
Why does my graph not display all the filter options?
- The “include undetermined parental birth dates” filter only displays in the graph if there are breeders in the studbook with undetermined birth dates. If no breeders have undetermined birth dates in the studbook this filter option will not display.
- The “include MULTs” filter will now only display if there are MULTs assigned to animals in the studbook. If there are no MULTs in the studbook or there are MULTs in the studbook but they are not assigned to any animals then this filter option will not display.
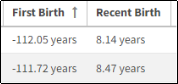
Why does the “first birth” or “recent birth” column display as a negative number?
If the sire of dam’s first or most recent offspring was born prior to the parent’s birth date, then these columns will display a negative number.
Users can address this by investigating the reported offspring of the sire or dam to validate that the reported parents are correct. Once the offspring has a birth date after the parent then the columns will no longer display negative numbers.
Back to Topics
Revised 5 March 2025