


Global Medical Resource: Expected Test Results
Produced by SPECIES360 Community via ZIMS and MedARKS, originally edited by J. Andrew Teare, MS, DVM
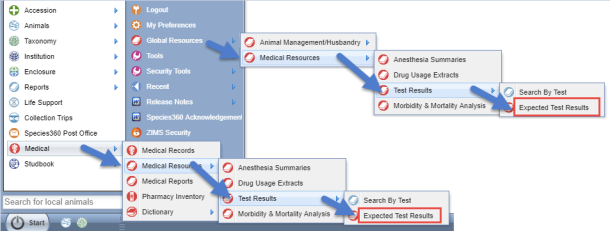
Access to the Global Medical Resource > Expected Test Results:
Topics:
Types of Results in this Resource
How the Resource is Calculated
Disclaimer
This project was made possible in part by the Institute of Museum and Library Services.
Types
of Expected Results in this Resource:
- Global Species Reference Interval : A valid reference interval calculated from at least 40 results obtained from healthy animals with data grouped at the species level
- Global Subspecies Reference Interval : A valid reference interval calculated from at least 40 results obtained from healthy animals with data grouped at the subspecies level
- Global Basic Statistics : When the data set for a species contains only 15-39 results obtained from healthy animals, a valid reference interval cannot be calculated, but the resource provides the mean, median and the high and low values of the existing results.
Test results for blood samples, along with associated body temperature and weight information, have been submitted to the Species360 database by member institutions for almost 40 years. Originally, paper forms were used to submit results to the database, but starting in 1992, member institutions using the MedARKS software gained the ability to submit records electronically.
The resource is currently calculated every month, allowing the resource to rapidly reflect additional test result values and any changes/edits to existing test values or health status. Users currently enter about 1500 new test results per day, leading to continuous growth of the overall ZIMS data set and this resource.
Searching the database:
The header of the report lists the following statistics:
- As of DATE:
- Test records included in analysis: #
- Global Reference Intervals: #
- Global Basic Test Result Statistics: #
- Animals*: #
- Species Count: #
* Total number of animals that contributed to statistics
- Number of Institutions: #
- Number of Countries*: #
* The number of countries contributing data to this resource
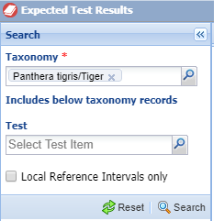
Use the Search panel on the left side of the resource to search by taxonomy. You can narrow the results by selecting a test type or simply click Search
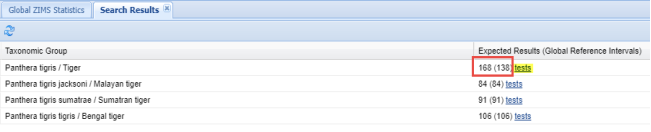
Then, click on the hyperlinked Tests to view the results for the desired taxonomy.
The first value is the total number of Expected Test Results calculated from the ZIMS database, the second value is the number of those Expected Test Results that are Global Reference Intervals.
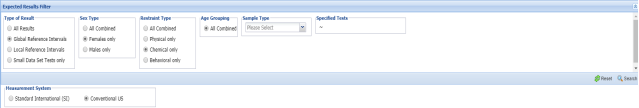
Use the Expected Results Filter to narrow type of result, sex, restraint and sample type. Also, select the measurement system.
The results are grouped by Test Category on separate tabs and can be exported to PDF.
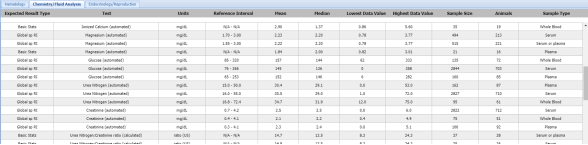
The data is displayed in columns on separate tabs by category. The columns include the expected result type, test name, the units of measurement, reference interval, the mean and median of test result values, lowest data value, highest data value, number of samples used in the calculations, the number of individual animals that were sampled and the sample type.
The data in this resource varies greatly between species and is a reflection of the information submitted to the Species360 database by member institutions. In general, there is an inverse relationship between average body size for a species and the number of tests in the resource for that species (smaller animals yield smaller samples, which allows for fewer tests).
About the Global Expected Results Resource:
“ Reference intervals are health-associated benchmarks essential for the interpretation of quantitative laboratory test results by medical practitioners. An interval is formally defined as a statistically derived range of values determined from a reference interval study encompassing the central 95% of values from a healthy reference population. Biomarker test results lying outside of the reference interval suggest an abnormal result and as such, establishing accurate reference intervals is crucial to informed clinical decision-making. ” 1
Species360 recognizes the potential problems associated with calculating physiological reference intervals from results obtained from multiple sources. Member institutions use different methods to collect and handle blood samples and different laboratories to process the samples, all of which can impact the range of values obtained. However, even within human medicine it has been recognized that there are situations (e.g., neonatal medicine) where it is not feasible to obtain enough results within a single laboratory to allow calculation of a reference interval and aggregating results from across multiple facilities is required. 2
Zoo medicine faces similar issues – small populations of many species within an institution limit the number of samples that can be obtained, restraint considerations in some species limit the frequency of sampling and financial considerations may limit the routine analysis of samples from healthy animals. For many species in most institutions, acquiring the minimum 40 test results from healthy animals needed to calculate a valid reference interval can take decades. When locally-calculated expected results are not available, calculating reference intervals using a global data set is a reasonable alternative. Clinicians need to be aware of the limitations of global expected results, but ultimately, a global reference interval is still vastly more useful as a diagnostic criterion than either comparing results to a reference interval from a different species or having no information at all. This ZIMS global expected results resource is both a unique and an invaluable basis for the assessment of diagnostic test results.
1. Karbasy K, Ariadne P, Gaglione S, Nieuwesteeg M, Adeli K. Advances in Pediatric Reference Intervals for Biochemical Markers: Establishment of the Caliper Database in Healthy Children and Adolescents. Journal of Medical Biochemistry . 2015;34(1):23-30.
2. Ferré-Masferrer M, Fuentes-Arderiu X, Alvarez-Funes V, Güell-Miró R, Castiñeiras-Lacambra MJ. Multicentric reference values: shared reference limits. Eur J Clin Chem Clin Biochem. 1997;35:715–8.
How the reference intervals are
calculated
:
Species360 takes steps to minimize the impact of potential problems and maximize the quality of the reference intervals. Results are recalculated based on new and changed data every month. The full set of rules to maximize the value this global resource is complex, but the essential features are:
- Only test results where the indicated health status was normal at the time of sample collection are included in the analysis (this is a primary filter for this global resource and the importance of maintaining complete and accurate health status records cannot be emphasized enough)
- Any tests on a sample where the animal was only identified to the genus level are excluded from analysis
- Any tests on a sample marked as deteriorated are excluded from analysis
- A set of result values based on taxonomic grouping and test method, and not already excluded by previous rules, is extracted from the database, and tested for outlier values using Tukey's inter-quartile range method. Fences were set at 3 times the IQ range to favor retention of values. If outlier values are identified, these results are excluded and the remaining results in the data set are tested for outliers again (same method). Any additional outliers values are also excluded from the reference interval calculations (as recommended in American Society of Veterinary Clinical Pathologist’s Guidelines for the Determination of Reference Intervals in Veterinary Species)
https://www.urikapathology.com/publications/FriedrichsHarrRefInt2012.pdf
Note: Tukey's outlier detection method is relatively insensitive to the shape of the distribution curve and is normally an excellent method to detect multiple outlier values. However, some very highly skewed distributions will result in an excessive number of values being classified as outlier values when this detection method is used. Specifically, when given a results set with a large number of zero values and a relatively small number of positive values, such as is common for a set of basophil count results, Tukey's method will often classify all or almost all the positive values as outliers. Excluding all the positive results from the reference interval calculation is clearly not appropriate. These highly skewed distributions are characterized by a lower quantile Median Absolute Deviation (MAD) of zero (or very close to zero), with a positive MAD for the upper quantile. To improve retention of results for highly skewed distributions, when the software detected a lower quantile MAD of zero combined with a positive upper quantile MAD, then Tukey's method was applied only to the results in the upper quantile and only the results greater than the upper fence value were classified as outliers; all other result values were retained for the calculations. This modification to Tukey's method resulted in increased retention of result values with only the very highest positive values (true outliers) being excluded for these highly skewed distributions. When highly skewed distributions were detected, the remaining results in the set are not retested for outliers prior to calculating a reference interval.
- If the data set is derived from a single institution, calculations are discontinued for that species/test combination (such a restricted data set might jeopardize anonymity of the data source).
-
Final processing on any data set that has passed through the above filters depends on the number of remaining test values.
- Data set has 40 or more test values: Reference intervals are calculated using a non-parametric method
- Data set has between 15 and 39 results: A reference interval is not calculated, but the basic statistical values of the mean and median are reported, along with the lowest and highest test result values in the data set.
- Less than 15 data points: No information is calculated or provided in this resource.
Disclaimer
:
These reference intervals are provided to you on an
AS IS
basis. Species360 takes reasonable precautions to ensure that the global reference intervals, calculated from the test results entered by our member institutions, are of the highest possible quality and we test the validity of the submitted information in multiple ways. However, millions of test results in the system makes it impossible to manually review all the information submitted by member institutions and the data selection and analysis is rule-based and automated. Only test results from animals recorded with a normal health status at the time of sampling are included in the reference interval calculations. All test results associated with samples flagged as deteriorated and samples marked for exclusion are also excluded. Within the set of remaining results, statistical tests identify and eliminate outlier values. Despite these and other data quality measures, unlikely test values are occasionally included in the calculations and the resulting reference interval will be wider than the true population variation, slightly reducing the diagnostic value of that specific reference interval. Even so, we are confident that the vast majority of reference values will prove helpful for interpretation of test results obtained at your institution. Clinicians should always remain aware that these are reference intervals, not diagnostic criteria. Any test result falling outside the appropriate reference interval should result in a clinical evaluation of that result and a determination of the clinical significance of that result, but should not be taken as an absolute indicator of disease or even of an abnormal health status.
As always, clinicians need to exercise their own judgement and use their clinical experience when using these reference intervals to interpret test results from captive wildlife.
Additional details:
Revised 5 March 2025
It is the mission of Species360 to facilitate international collaboration in the collection and sharing of information on animals and their environments for zoos, aquariums and related organizations.
www.Species360.org – Global Information Serving Conservation