


Survival, Reproduction & Growth Reports
Survival, Reproduction & Growth Reports are no longer available, a new and improved report is under construction and will be released in the near future. For more information see
https://bit.ly/SRGupdate
Contact support@Species360.org
With thanks to our Conservation Science Alliance supporting partners: the World Association of Zoos and Aquaria, Copenhagen Zoo and Wildlife Reserves of Singapore, the
Survival, Reproduction and Growth Reports (SRG) are now available in ZIMS.
Resources Covered
Role Access and Report Navigation
Role Access and Report Navigation
Local administrators will be provided with the access to the global and institutional data once the new reports are live in ZIMS. Additional access must be granted via customized roles by your local administrator.
There are two new options under the Global Reports and Tools role menu in ZIMS:
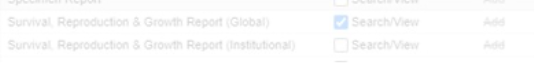
Access to the global option will permit access to the globally pooled SRG reports, while granting access to the institutional option will permit user to see any SRG data that is available as of the last compilation of reports based off of your institution’s specific holder data.
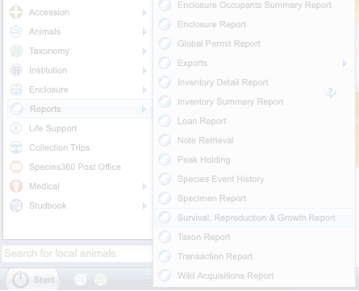
Under the Start>Reports menu you will find institutional specific reports.
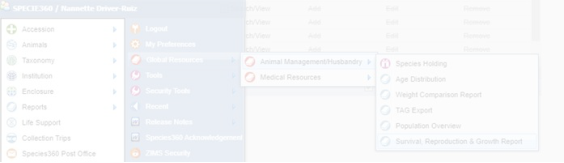
The version of these reports based on the global data in ZIMS are found under Start > Global Resources > Animal Management/Husbandry.
If you have access to both reports, you will notice that at the top of the report there are options for Global or My Institution.
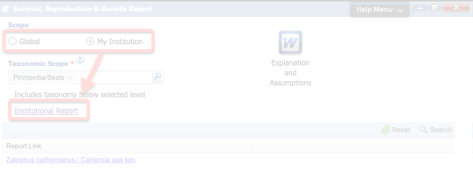
When selecting My Institution, there is a new link to the specific reports for your collection that will load in a new page – your data will be organized at the order level with included taxa represented only when sufficient data was present to create a report based on your holdings.
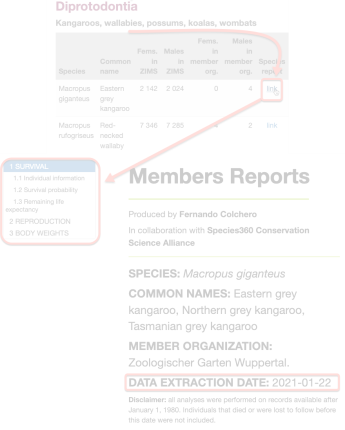
The data’s date of extraction is presented on the species-specific reports to help you understand the currentness of the data included.
Printing
Currently there is no dedicated ‘export’ option on the reports. To print any records, you can ‘print page’ by pressing ‘Ctrl+p’ (Apple: ‘Command+p’) on your keyboard. If you have a PDF creator option, you can save to PDF from the print screen or send the pages to your printer.
Back to Resources Covered
Survival
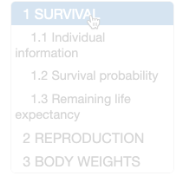
The data on survival in ZIMS is presented in three sections for institutional data and 2 sections for global data. Section on Individual information is only present on institutional data pages.
1.1 Individual information
A table provides general information of the individuals kept at the institution and that were still alive at the date of data extraction. The information includes their GANS, sex, birth date, age at the date of data extraction, as well as the average probability of surviving one or five more years for an individual of that age and sex.
1.2 Survival probability
A plots shows the probability that a female (top) or male (bottom) reaches a given age in years. Survival probability by age (i.e. probability of surviving to a given age).
Figure 1.1: Survival probability by age (i.e. probability of surviving to a given age).
1.3 Remaining life expectancy
A plots shows, on the left, the average number of years a female (left) or male (right) of a given age can still live. The right panels show the time from birth (squares) to the date of data extraction an individual has lived (i.e. age at date of data extraction), and the average number of years they can still live based on the global analysis.
Remaining life expectancy (average remaining life at a given age) for all individuals in ZIMS with records available after January 1, 1980 (left panels), and individual remaining life expectancies for individuals alive in the zoo at the data extraction date (right panels).
Figure 1.2: Remaining life expectancy (average remaining life at a given age) for all individuals in ZIMS with records available after January 1, 1980 (left panels), and individual remaining life expectancies for individuals alive in the zoo at the data extraction date (right panels).
Back to Resources Covered
Reproduction
The data on reproduction in ZIMS is presented in five sections for institutional data and four sections for global data. Section on Individual information is only present on institutional data pages.
Disclaimer: analyses were performed on records available after January 1, 1980 and for which maternity (or paternity) was known to at least 80% certainty.
2.1 Individual information
Description: The table below shows general reproductive information of individuals kept in the institution. Each row corresponds to a birth. The column for Parent age shows the age of the parent at the date of birth of the offspring. The column Born in member org indicates if the offspring was born in the member organization for which the report was created.
No maternity or paternity recorded for individuals in the zoo.
2.2 Average number of offspring per age and sex
A plot shows the average number of offspring produced by females (top) and males (bottom) per age (in year units). These averages were calculated by dividing the number of births from females or males of a given age, by the total number of available females or males. These did not include individuals for which contraception was recorded at that age. However, all other available individuals were counted, we could not distinguish individuals that had been physically separated from the opposite sex.
Average number of offspring produced per age and sex. The vertical colored and white lines represent the standard errors of the values (i.e. measure of uncertainty in the values). Bars are faded when less than 30 females or males were available for analysis.
Figure 2.1: Average number of offspring produced per age and sex. The vertical colored and white lines represent the standard errors of the values (i.e. measure of uncertainty in the values). Bars are faded when less than 30 females or males were available for analysis.
2.3 Distribution of litter sizes
A plot shows the proportion of times a specific number of offspring was born per reproductive event for females (top) and males (bottom). We defined reproductive event as all births produced by the same individual within a week of each other.
Distribution of the number of offspring produced per reproductive event.
Figure 2.2: Distribution of the number of offspring produced per reproductive event.
2.4 Observed reproductive lifespan
A plot shows the lifespan of adult females (horizontal gray lines) in years, as well as the reproductive events (yellow to orange sections) and the litter sizes per reproductive event. We defined reproductive event as all births produced by the same individual within a week of each other.
Observed reproductive lifespan for all mothers in ZIMS after January 1, 1980 and with maternities known at least to 80% certainty. Birth events are shown in yellow to red as a function of number of offspring per event.
Figure 2.3: Observed reproductive lifespan for all mothers in ZIMS after January 1, 1980 and with maternities known at least to 80% certainty. Birth events are shown in yellow to red as a function of number of offspring per event.
2.5 Birth seasonality
A plot shows the proportion of births occurring in each month, depicted by the height of the red triangular shapes. High seasonality occurs when the triangular shapes are cluster in few months.
Proportion of births per month from parents in ZIMS after January 1, 1980.
Figure 2.4: Proportion of births per month from parents in ZIMS after January 1, 1980.
Back to Resources Covered
 Growth
The data on growth in ZIMS is presented in two sections for institutional data and one sections for global data. Section on Individual information is only present on institutional data pages.
Disclaimer: analyses were performed on records available after January 1, 1980. In addition, all weight measures are taken from individuals in ZIMS, thus these results may not represent weight values in the natural habitat of the species.
3.1 Individual information
Table 3.1 shows general information on times when individuals kept in the institution were weighted. Known weight information. Ages are given in years and weights in kg.
3.2 Global body weight information
A plot shows lower and upper percentile intervals of weights per age in years for females (top) or males (bottom). The intervals are: lowest 1%; low 1% - 33%; mid 33%-67%, high 67%-99%; highest upper 1% (higher than 99%).
Percentiles of body sizes on all individuals in ZIMS alive after 1 December 1980.
Figure 3.1: Percentiles of body sizes on all individuals in ZIMS alive after 1 December 1980.
Back to Resources Covered
Explanations and Assumptions
This resource provides a species-level, global-level summary of survival probability, remaining life expectancy, average offspring per year as a function of age and sex, expected number of offspring per birth event (litter size), reproductive lifespan, birthing events by month of the year (seasonality) and body weight by age and sex (growth curves). All analyses were performed using Species360 records on individual animals available after January 1, 1980. Individuals that died or were lost to follow-up before this date were not included.
Survival probability: The probability that a female or male reaches a given age in years.
Remaining life expectancy: The average number of years a female or male of a given age can be expected to live.
Average number of offspring by age for each sex: The average number of offspring produced by females and males as a function of age (in year units). These averages were calculated by dividing the number of births from females or males of a given age, by the total number of available females or males. These calculations did not include known contracepted individuals but information regarding physical separation from the opposite sex was not available.
Distribution of litter sizes: The plots show the proportion of times a specific number of offspring was born per reproductive event for females and males. A reproductive event is defined as including all offspring produced by the same individual within a one-week period.
Observed reproductive lifespan: Each reproductive event (short colored bar), where dam is known with at least 80% certainty, is shown over the lifespan of the female (grey bar). A reproductive event is defined as including all offspring produced by the same individual within a one-week period.
Birth seasonality: The proportion of births occurring in each month is depicted by the height of the red triangular shapes. High birthing seasonality occurs when the triangular shapes are clustered in just a few months.
Body weights by age: Displayed as percentile intervals as a function of age, with separate calculations for males and females. The weight intervals are: lowest 1%; low 1% - 33%; mid 33%-67%, high 67%-99%; highest upper 1% (higher than 99%).
These reference materials are provided to members on an AS IS basis. Species360 takes reasonable precautions to ensure that the global summaries, calculated from data entered by our member institutions, are of the highest possible quality. The validity of the submitted information is tested in multiple ways, and records that are incomplete, contradictory or statistically unlikely are excluded. However, with millions of records in the system, it is not possible to manually review all the information submitted by member institutions and the data selection and analysis processes are rule-based and automated. Even so, we are confident that the vast majority of these global data summaries will prove helpful for collection evaluation and management at member institutions.
Back to Resources Covered
Additional Resources:
Revised 5 March 2025