


Global Member Data Reports
Global Member Data Reports provide a summary of all animal data in ZIMS, comprised of two components. Animal Charts offer interactive charts of global and institutional animal counts, with filters such as IUCN Red List, CITES, and taxonomy, updated weekly. Member Maps display the global locations of ZIMS member institutions.
Topics
Accessing Global Member Data Reports
Global Member Data - Animal charts
Global Member Data – Member maps
Video Introduction
Learn about Global Member Data - Animal Charts in this video.
Accessing Global Member Data Reports
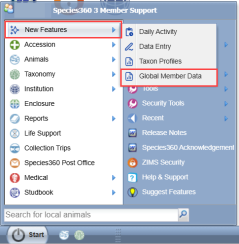
The reports can be accessed from the
ZIMS Start Menu > Global Resources > Animal Management/Husbandry > Global Member Data
.
The reports can also be accessed directly by using the URL:
https://zims2.species360.org/global-member-data
or finally by creating a QR code to access quickly from a mobile device.
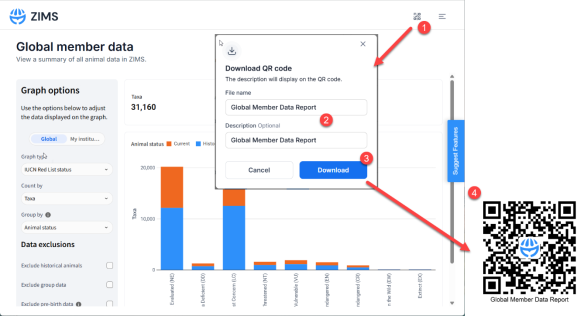
To create a QR code to access Global Member Data reports, first access the report then:
- Click the QR code icon
- Name the file
- Click Download
-
Open the downloaded QR image file, to get an image like this.
Note: This QR code will open the Global Member Data Report but will not save applied filters.
Global Member Data - Animal charts
This report displays global and institutional animal counts, including total number of unique taxa, total number of animals. By default when first opened it will display animals held globally by Taxonomy.
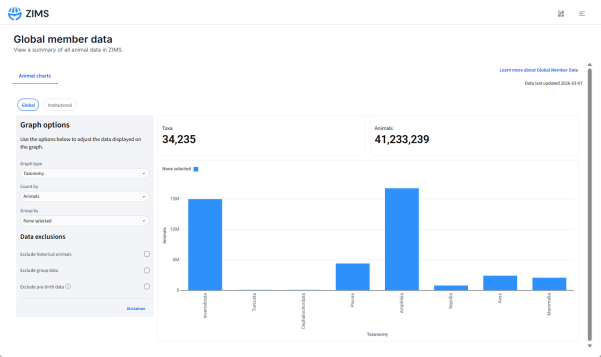
The report is interactive and can show a page for Global or Institutional data. The Global page shows data across all of ZIMS, and the Institutional page filters the dataset based on the logged in institution.
Users can use filters on the left-hand side to view different graphs. The filters are synced across the two pages, meaning that selections or changes made on one page will affect both pages.
The data on the graphs can be customized with the filters below.
Select which graph to view:
- CITES appendix
- EU Annex
- IUCN Red List Status
- Taxonomy
Select the graph count:
- Animals
- Taxa
Group counts by:
- Accession type
- Animal status
- Birth type
- Taxonomy
- IUCN threatened/non-threatened
- IUCN Red List status
- Sex
Customizing the Graphs
The example graph below shows:
- IUCN Red List Status of animals globally in ZIMS
- Number of unique taxa in each Red List category
- Animal status split into Current (orange) and Historical (blue)
-
This is just one example. You can create many other graphs by adjusting filters.
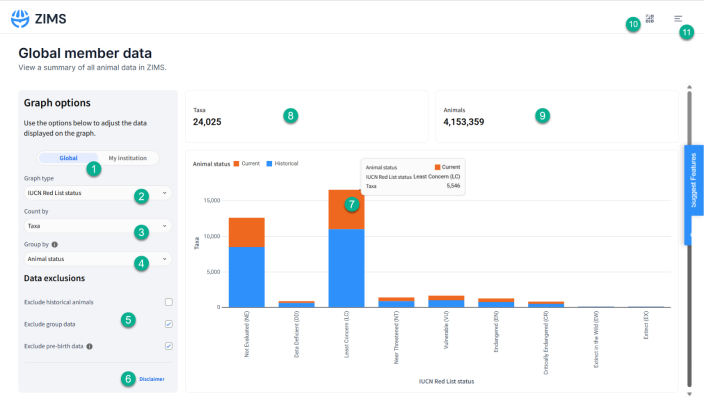
- Select Global data or Institutional data.
- Select the graph type from the drop-down menu. Options available include; CITES appendix, EU Annex, IUCN Red List Status, Taxonomy.
- Select how to count the data included in the graph. Options include by; Taxa or Animals.
- Select how the bars on the chart display/group the data. Options include by; Accession type, Animal status, Birth type, Taxonomy, IUCN threatened/non-threatened, IUCN Red List status, Sex.
- Choose what data to exclude from the graphs. Historical animals, group data and pre-birth data can be removed from the graphs as needed.
- Click to see the disclaimer .
- Hover over points on the graphs to see more information.
- Total number of unique Taxa currently included in the filtered data set.
- Total number of Animals included in the filtered data set.
- Create a QR code to access this page in the future.
- Access the menu to view other features in ZIMS or Log Out.
- Click to view the help document.
Disclaimer
To ensure accurate analytics, some data has been excluded from the analysis, including:
- Incomplete accessions
-
Animals within local collections
The analytics incorporate data from group species. Due to the complexities involved, numbers may not be exact. For group and colony data, the group count has been used to represent the number of animals. Colony counts are not currently included.
For historical census counts, the maximum group census count has been used. You have the option to exclude group data and/or historical data from the analytics using the checkboxes in the left panel.
This chart is updated weekly, so there will be a slight delay between new data being added to ZIMS and its appearance in these graphs.
Global Member Data – Member Maps
This report displays an interactive map of ZIMS members, including Biological Institutions, Global/Regional Associations, and Associations of Professionals.
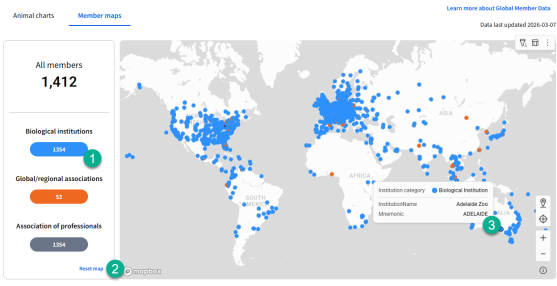
1. Clicking the colour buttons on the left will filter the map to those member types.
2. Clicking "All members" or "Reset map" will reset back to all values.
3. Hovering over a map point will tell you the institution name and mnemonic.
If you encounter any issues with the report, please email support@species360.org
Revised 5 May 2026