


ZIMS for Care and Welfare
The ZIMS for Care and Welfare project, sponsored by 23 members, streamlines access to critical key care and welfare indicators by enabling ZIMS to systematically track and monitor inputs and outputs of animal care. This community project expanded insights available to our community in support of animal care, while following WAZA's 5-Domain model for welfare by monitoring behavior, physical health, environment, nutrition and mental domain.
Topics
|
|
|
|||
|
|
|
|||
|
|
|
|||
|
|
|
|||
|
|
|
|||
|
|
|
|
|
|
|
|
|
|||
|
|
|
|||
|
|
||||
|
|
|
|||
|
|
||||
|
|
|
|||
|
|
|
|||
|
|
|
|
||
|
|
|
|||
|
|
||||
|
|
||||
|
|
||||
|
|
||||
|
|
||||
Activating the Module
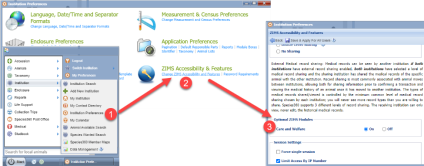
The Care and Welfare module (CAW) is available by default; the Species360 Global Admin does not have to activate it for your institution. However, your Local Admin must turn it on for your institution. This can be done by going to Institution Preferences (1) > ZIMS Accessibility and Features (2) > Care and Welfare (3). Click here for a guided walkthrough in ZIMS on enabling this feature .
Displaying CAW Notes in Husbandry Notes
Displaying Care and Welfare Notes in Husbandry Notes is now a preference:
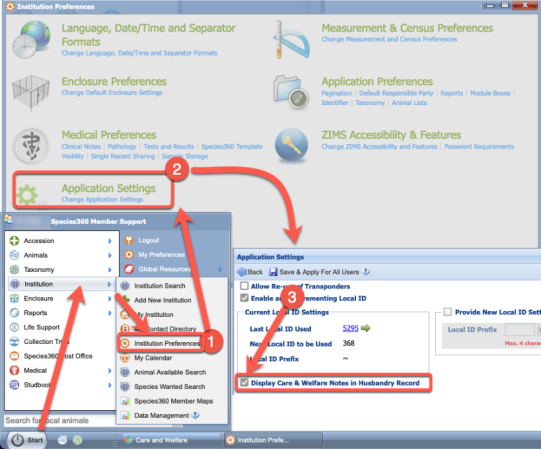
As Local Administrator, go to Start > Institution > Institution Preferences (1), open Application Settings (2), then Enable/Disable “Display in Husbandry Records” as desired (3). Note: Enabling this preference for animal records that are shared externally will also permit these Care and Welfare notes to be shared with the other Species360 Member.
 Managing Access to Care and Welfare
As with all ZIMS functionality the access to Care and Welfare is via your Role. Local Admin is the only Species360 template that has access to it as default. For all other roles you will need to add it to an existing role or create a new custom role.
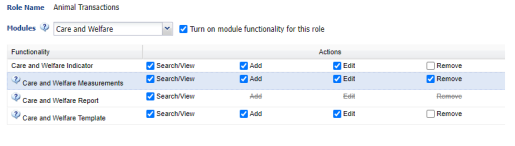
Ensuring Roles have the correct functionality
- Turn on Role access for Care and Welfare by checking the tick box ‘Turn on module functionality for this role’
- Functionality within this module can be adjusted as needed by selecting various Actions. Allowing for differing permissions for different Roles.
-
 When in ZIMS hover over the icon to find out what actions are required for specific functionality.
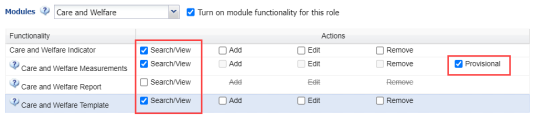
Provisional data entry in Care and Welfare
If you wish to only provide
provisional data entry
to a user in Care and Welfare, they must at least have Search/view functionality for Care and Welfare indicators, measurements and templates. Then ensure the tick box for provisional is checked in Care and Welfare measurements.
Back to Topics
Accessing Care and Welfare Module
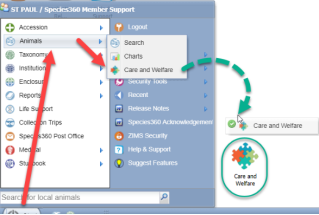
The Care and Welfare module is found in the start menu under Animals.
You can click and drag the module onto your ZIMS desktop for easy access.
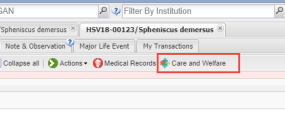
The module can also be accessed directly from an animals record by clicking on the Care and Welfare button on the Details tab. Clicking the button will automatically take you to the CAW templates for that animal.
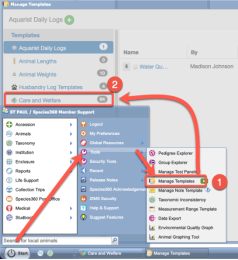
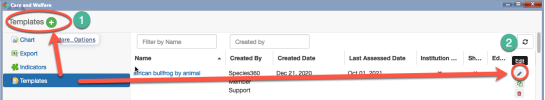
Care and Welfare Templates can be accessed outside the Care and Welfare module through the Manage Templates menu.
Click Start, Tools, Manage Templates (1). If you have permission, you will see the current count of Care and Welfare templates available. Clicking the link will load Care and Welfare.
Manage templates can also be accessed through the Animals and Enclosure modules through the ‘Batch Measurements’ button.

Indicators
Before beginning to record data in the system, you must first configure your Indicators and create Templates. These Indicators and Templates are institution specific, so you design templates for YOUR needs.
List of the global indicators that are managed by Species360 and their definitions
.
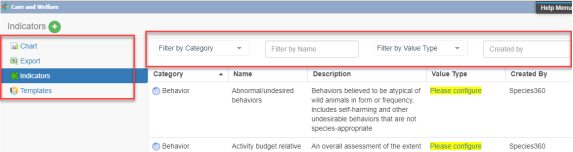
When you open the Care and Welfare module the dashboard is displayed. On the left you see four options – Chart, Export, Indicators and Templates. The Templates and Indicators have filter options at the top.
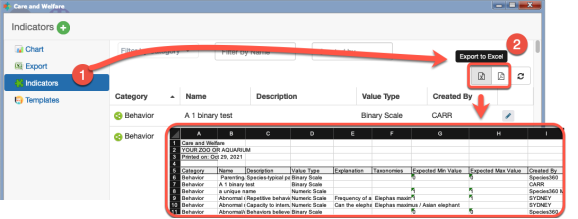
You can export a list of your configured indicators. In the indicator list (1), select the export option to download configured indicators into Excel or PDF format (2)
Configuring Indicators
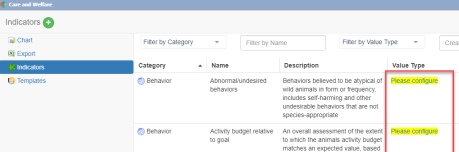
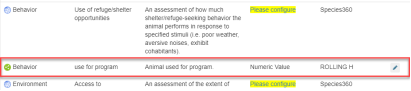
You will first need to configure your Indicators. Select Indicators from the upper left to activate. If the Value Type says “Please Configure”, that Indicator has not yet been configured. You do not need to configure all the Indicators, only those you decide to use in your Templates. Indicators will not appear for selection in Templates if they are not configured.
Some things to consider when you are deciding what Indicators to configure are:
• Any Accreditation requirements
• Any legal requirements (does your state or city require certain monitoring?)
• What your Board wants to know
• What your Staff wants to know
The five categories were taken from the “Five Domains” model from “Caring for Wildlife – the World Zoo and Aquarium Animal Welfare Strategy”
http://www.waza.org/en/site/media/publications-1264077522/waza-strategies
• Behavior
• Indicator’s that reflect the animal’s responses to their surroundings
• Activity level, aggression, reproductive, parenting
• Environment
• Indicators that relate to environmental parameters
• Enclosure access, shelter, external impacts
• Mental Domain
• Indicators that reflect the affect or disposition of the animal as observed by caretakers
• Attitude, use of environment, general assessment
• Nutrition
• Indicators that reflect the animal’s interaction with food and feeding processes
• Consumption, food choices
• Physical Health
• Indicators related to the animal’s physical and physiological responses to factors such as disease, parasites, injuries, and developmental abnormalities
• Evidence of discomfort, fecal quantity & quality, mobility and appearance
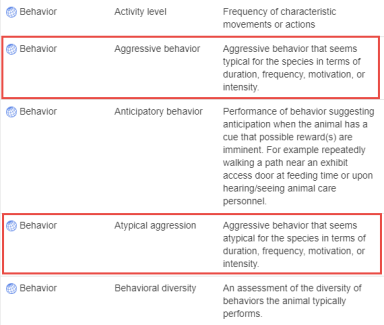
You should read all the Descriptions to help you select the correct Indicator Category and Name. For example, you have a Board directed requirement to track all aggression that is outside the norm for the species.
Reading the definitions, you would select Behavior / Atypical Aggression and NOT Behavior / Aggressive Behavior due to the Description.
The first thing you will be asked when you select the Please Configure option is to select the Value Type you want assigned.

What information you hope to record will drive the Value Type:
Binary - Yes or No options as defined
Numeric Scale- Numbers with definitions. Example a “1” means excellent whereas a “5” means poor, or negative, neutral or positive
Numeric Value- Free choice numbers with no definition
Percentage - A rate out of 100
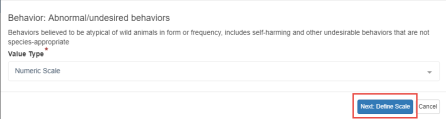
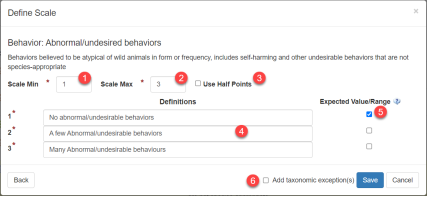
In our example for ‘Behavior: Abnormal/undesired behaviors’ we selected Numeric Scale. We chose this Value Type because it will allow us to capture the degree of these behaviors, from none to many. We are then asked to “Define Scale”.
First you need to set the scale. Use the Scale Min (1) to reduce the number of options and set your numeric values. Scale Min has no limit and can go into negative figures. Use Scale Max (2) to increase the number of options and set your numeric values. Scale Max can be set to any value as long as it is at least 2 numbers above Scale Min (e.g. -1 and 1, or 0 and 2). To include Half points (i.e. 1.5) in the numeric scale (3) click the check box next to ‘Use Half Points’.
Next, define what each of the options mean (4), then you can choose to select which options you want as the Expected Value (5). You can choose more than one, and when entering data any value entered outside of the expected value/range will have a warning in red that it is outside of the range.
You can also choose to add another indicator and/or add taxonomic exceptions (6), which means you can define another scale for a different taxonomic group.
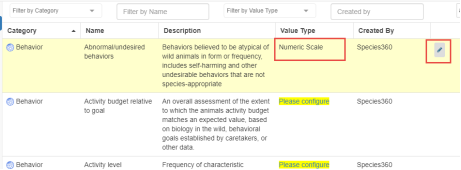
Once the Value Type is Configured the Value will display in that column. If you want to edit the Value Type, select the Edit icon. For most of our animals we want to capture only the 3 Values, but for our Primates we want more detail. We select the pen icon to edit.
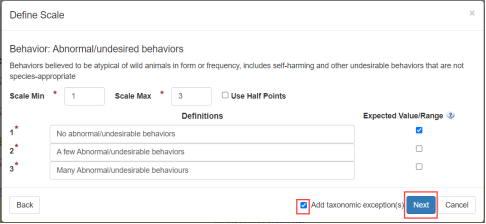
In the Define Scale screen we check the Add Taxonomic Exceptions box. The taxonomy selected can be at any node of the tree and you can select to include taxa below or not. Note that the Save button now says Next.
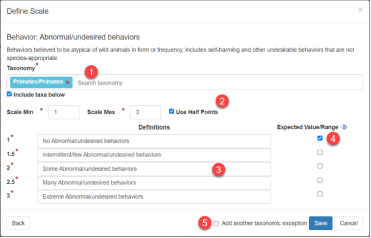
Select the taxonomy for the new list of options to apply to (1). Because we want more detail in what we gather for our Primates, we have chosen Primates.
Choose the scale (2), you can keep this the same if required, but we have ticked the box to include half points. Redefine the option definitions if required (3), and re-select your expected value or range if required (4).
If you want to add another taxonomic exception, check the box (5), otherwise click Save.
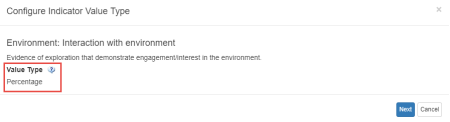
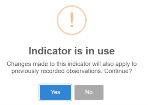 For Environment: Interaction with Environment we have chosen a Value of Percentage. However, we recorded an Expected Range of 50-80% and we want to change it. When we select to edit, we receive a warning that the indicator is in use. We select Yes, understanding that any changes will also apply to previous records.
Because the Indicator has been used in previous records we cannot edit the Value Type, it is greyed out.
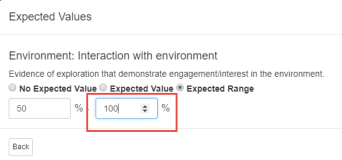
We can, however, change the Expected Values and we change the Expected Range maximum from 80 to 100, meaning we would like to see the animal use the entire enclosure.
Creating New Indicators
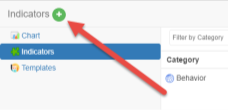
If you do not find an Indicator and a Description that meets your needs, you can add a local one by selecting the green circle/plus sign Add New icon.
For example, the keepers have noticed that some members of our penguin colony are exhibiting excessive vocalizations. They would like to capture and compare it with other factors to see what may be causing it. There is not a Global Indicator to capture this so we will create a Local Indicator.
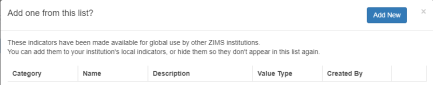
Before taking you to the create new screen, you have the option to add shared indicators that other institutions have created as local indicators for your institution to use. To create your own, click Add New at the top of the list.
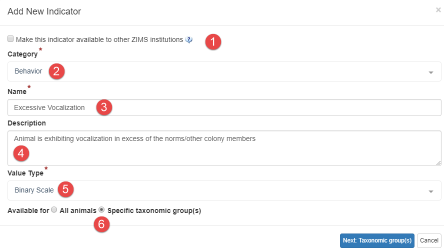
If you want to make your indicator available to other institutions, check the ‘Make this indicator available to other ZIMS institutions’ box (1). If shared, you will no longer be able to edit the indicator, except for your expected values/ranges.
Select an appropriate category from the five options (2), then name the indicator (3) so that it is easily identifiable.
Add a description of what you are trying to capture (4), then select the Value Type (5). We have chosen Binary because we want a simple Yes or No for the behavior.
When creating a new indicator from scratch, you can choose to have it available for all animals, or for specific taxonomy (5). We want this Indicator available only for our penguins so we check the Specific Taxonomic Groups checkbox.
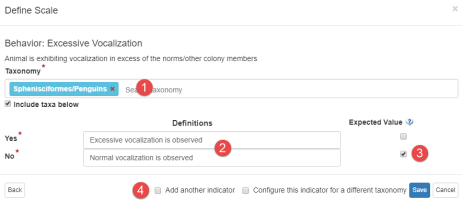
As we chose to limit the indicator to specific taxonomic groups, we now need to choose which taxonomy to limit to (1), you can choose multiple taxonomy here. We want to limit the taxonomy to penguins. Next, you need to define your options (2). Because we have chosen binary, we define the Yes or No responses. Set your expected values/ranges (3), we have checked the expected value to be normal vocalization. Finally, you have the option to add another indicator or another taxonomy (4). We are done so we hit Save.
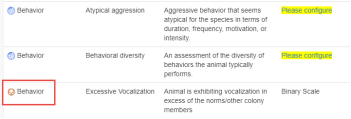
The new indicator is added to your list of Indicators. The house icon indicates that it is a Local Indicator. You can edit or delete these Indicators as long as they have not been shared. Only your institution will have this Indicator available as a selection because you did not check the sharing box.
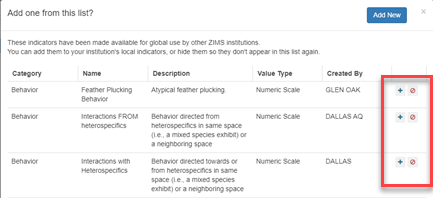
Shared Indicators
Shared indicators are indicators added locally by other institutions who have allowed the indicators to be used globally. To find shared indicators, click on the green + at the top of the indicators screen. A list of shared indicators with their descriptions and value types will appear. To select a shared indicator for use at your institution, click the blue + next to the indicator to add it. If you don’t have a use for the indicator (for example elephant foot care and you are an aquarium), click the red circle to remove it from your list.
If you add a shared indicator to your institution, the indicator displays with the green sharing icon. With shared indicators you cannot edit the Category, Name, Value Type or Description, but you can edit your Expected Values and add Taxonomic Exceptions. You cannot delete the indicator.
Templates
The Templates screen provides a list of all your current CAW templates. It is possible to filter this list by template name, who it was created by, or by animals the templates are assigned to. The Last Assessed Date helps your team track when data was last updated.

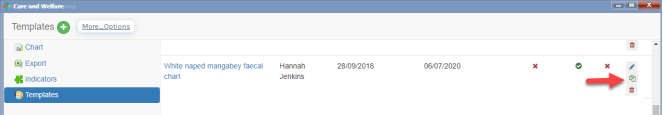
Create a new template
To create a template using the indicators you have configured,
- Select Templates and the Add New icon (+)
- Or edit an existing template by clicking on the pen icon.
*Note: consider making multiple templates for smaller groups of animals – loading a large collection of animals in one template can result in a less responsive experience.
As with shared indicators , when you choose to add a new template, you are given the option to choose shared templates . To continue adding a new template, click Add New at the top of the list.
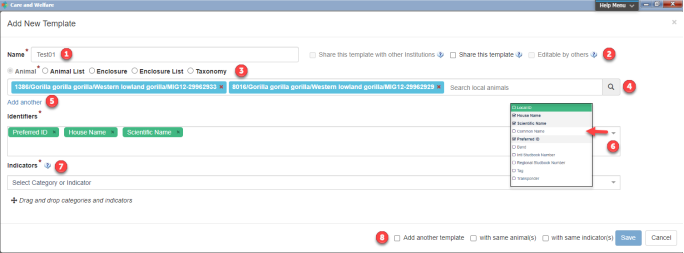
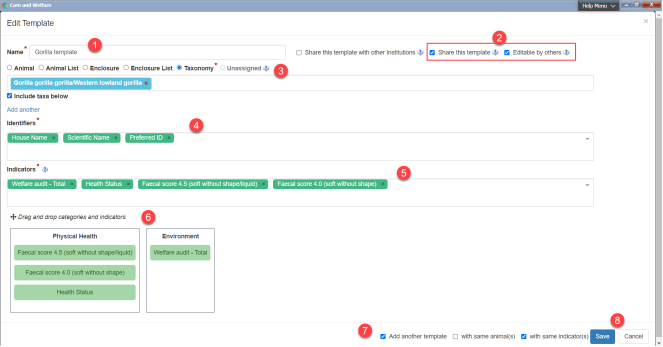
- Enter a name for your template, the name of the template must be unique.
- Select if you want to share with others or allow others to edit the template.
- Select the entity you want the template to cover. If you do not have Animal or Enclosure Lists, those options will not display for selection.
- If you have selected Animals, a magnifying glass lookup will appear at the end of the search bar to allow you to search with additional filters, you can also add multiple animals in the search bar manually if you know their ID.
- If you want to add another entity, select Add Another. You can mix and match Animals, Enclosures and Taxonomy. When selecting Enclosures, it will pull from the current occupants. The Animals entity will only allow you to select it once as it is a multiselect bar unlike the other entities.
-
Add the identifiers you wish to include in the template. This is limited to:
- Preferred ID
- Local ID
- House Name
- Scientific Name
- Common Name
- Band
- Intl Studbook Number
- Regional Studbook Number
- Tag
- Transponder
-
Select your Indicators to track on the template. Hovering over any indicator will bring up a description of that indicator. Checking the top-level Category will select all the Indicators under it. You can also see which indicators are Global indicators (
 ), Shared indicators (
 ) and Local indicators (
 ).
).
Select the sort order of your indicators when creating or edit/updating a template for ease of entry: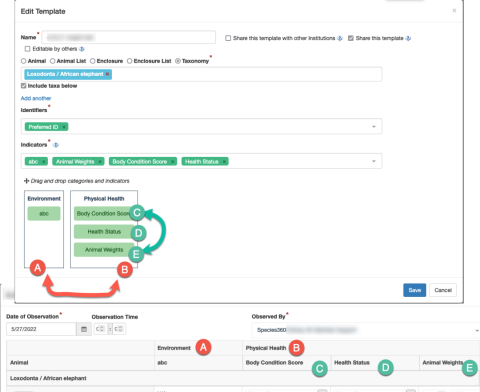
- Categories can be ‘drag and dropped’
- To display in you your preferred data entry format
- Similarly, the Indicators order in each Category
- Will display in the edit mode
- In the order defined in the template set up
-
Finally, you can easily Add Another Template from here (7). You can select the same animals and/or the same Indicators, otherwise click Save to finish.
NOTE: Animal Weights, Target Weight Range, Body Condition Score and Health Status are available to select from as defaults. Animal Weights entered under the Care and Welfare module will display in the Animal Graphing Tool just as the ones entered in the Weight grid do.
Shared Templates
Shared templates are templates added locally by other institutions who have allowed the templates to be used globally. Sharing a template automatically shares the indicators included in the template, and accepting a template automatically accepts the indicators within the template.
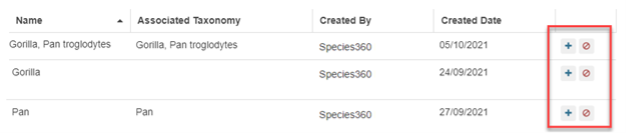
To find shared templates, click on the green + at the top of the templates screen. A list of shared templates will appear. To select a shared indicator for use at your institution, click the blue + next to the template to add it. If there is Associated Taxonomy the template will automatically be added to your list of templates to view. If you don’t have a use for the template (for example elephant welfare and you are an aquarium), click the red circle to remove it from your list.
If there is no Associated Taxonomy in the shared template, clicking the blue + icon will open a pop up where the template can be edited.
Editing the shared template
Editing the shared template will not edit the template at other institutions. It is editing aspects of the template that will be saved to your local templates list.
1. Name the template.
2. If you wish others in your institution to view the template select ‘Share this template’ and select ‘Editable by others’ if you wish to grant edit access to others at your institution.
3. Select the entities you wish to assign the template to. Multiple entities can be chosen by clicking the ‘Add another’ text in blue. Animal is the only entity which allows multiple to selected in one box.
4. Select the identifiers you want to be visible on the template.
5. Add or remove indicators from the template
6. Use the drag and drop feature to rearrange how the indicators will appear in the template.
7. If you want to create multiple templates from the one shared template click the checkbox next to ‘Add another template’. This can be used alongside the ‘with same animal(s)’ checkbox and/or ‘with same indicator(s) checkbox if desired.
8. Click Save and the template will now be saved in your local templates list to view.
Cloning a Template
To clone a template, click the clone icon  on your desired template.
When cloning a template, the Template you selected to clone opens in edit mode.
- The (Template) Name field shows as blank.
- The Entity field is blank, you can add new entities as required.
All other selections from the original template are prefilled in the new ‘clone’.
- The "share this template" and "editable by others" checkboxes retain what was checked/unchecked from the original template.
- The Identifiers field retains the choices from the original template.
- The new template will retain the indicators from the original template, but you will be able to edit the indicator selections to add or remove indicators.
Using a CAW Template
To use the Template, select the hyperlink from the list of Templates.
Depending on how the template was set up, the animals will display in a particular order. The animal ordering rules for Templates are as follows:
- Templates created by animal list display in preferred ID order
- Templates created by enclosure list display in preferred ID order
- Templates created by individual animals display in the order in which the animals were selected
- Templates created by taxonomy display in preferred ID order
- Templates created by individual enclosure display by enclosure, then in preferred ID order
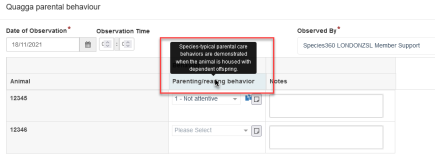
Add the date (mandatory) and time (optional), then fill the template for each animal and indicator. You do not have to complete all the fields to Save, if there are fields which you do not have data for you can leave these blank. Save and Repeat will save the data and keep the template open for additional entries. You can hover over any indicator in the template to see a description of that indicator.
Indicator value note:
You can add notes to each indicator value (indicator value note), and any additional notes not related to an indicator (CAW note).
The value added for the specific indicator will automatically append to this note, so add the note AFTER the indicator value has been chosen. To add notes to each indicator value, click on the  icon next to the data entry box.
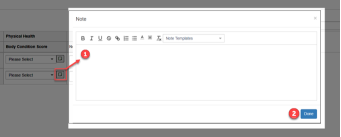
- This will bring up a pop-up box for you to enter your note. Write your desired note in the note field. It is also possible to select a Note template from the drop down list.
- Then click Done.
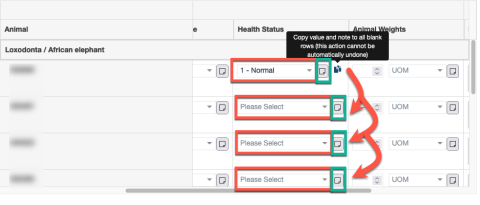
If the data you are entering is the same for multiple animals, you can enter the data for one animal and then copy the values into the remaining records in the column. To do this, enter your data for the first animal then select the copy icon  , and ZIMS will copy the value into the remaining records in that column (the animals must have the same configuration for that Indicator).
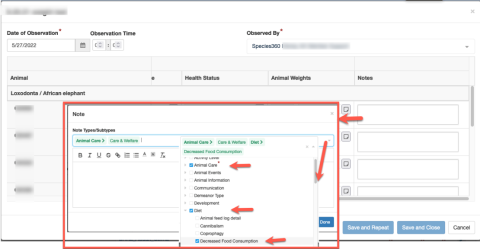
CAW note:
To add a CAW note which is not related to an indicator, use the Notes field on your template. Click in the field to bring up the pop up below. Enter your note and then click Save. The Notes field will open a free text entry field for you to record additional notes. There is a single Note field and it applies to all columns.
You can select multiple Note Types/Subtypes from this note entry field to better categorize your welfare notes:
Once you have filled out all your information, choose to Save and Close, or Save and Repeat to add data to the same template for another day.
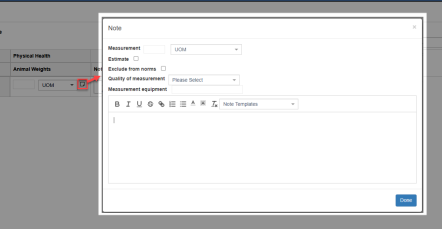
Animal weight note:
When adding an animal weight through the Care and Welfare module the same fields can be applied as when adding a weight in the Animal module. Click on this icon to include these, and use the note field to enter any details, these will be viewable on the animals record.
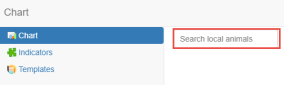
Chart
To view the Charts, select Chart and enter a GAN or other identifier.
The Chart will display the data recorded during the selected date range.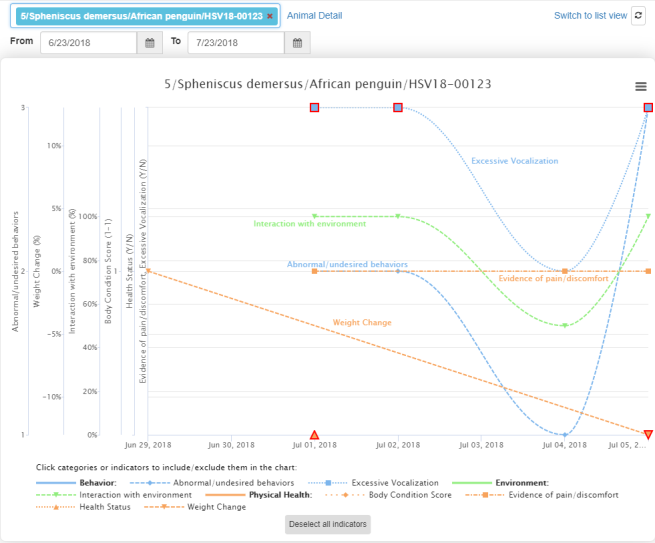
You can click on the categories or indicators at the bottom of the screen to include or exclude them from the chart. In the following chart, we have deselected the Physical Health category which has deselected all of the physical health indicators (highlighted in yellow).
By removing some Indicators, we can easily see that Excessive Vocalization, Interaction with Environment and Abnormal/Undesired Behaviors appear to be related.
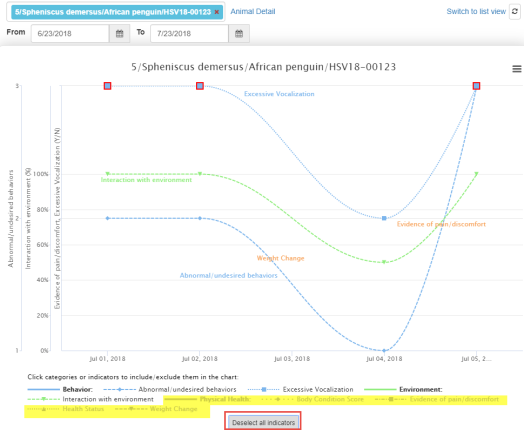
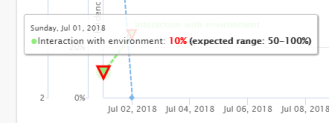
If an Observation is outside the desired Value/Range it will be outlined in red on the graph. Hovering over will display the desired Value.
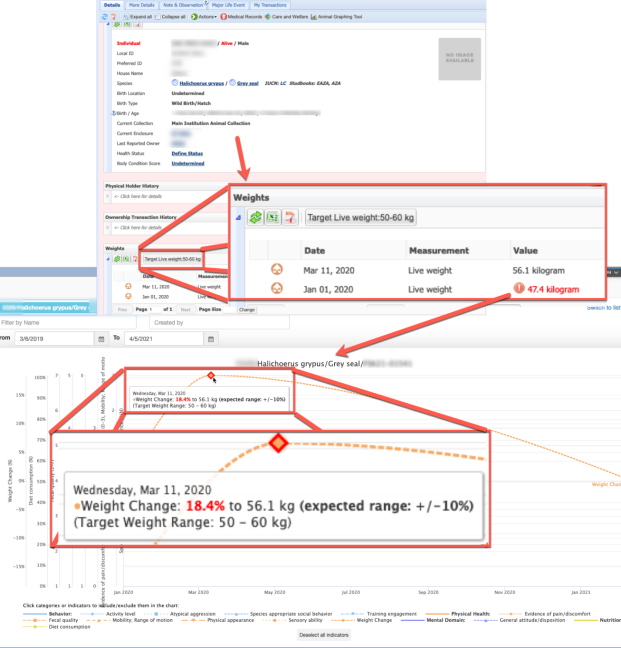
In addition to weights entered on the animals Basic Information screen in ZIMS for Husbandry, if a Target Weight Range is set up the animal being graphed in Care and Welfare, this range information will display as well.
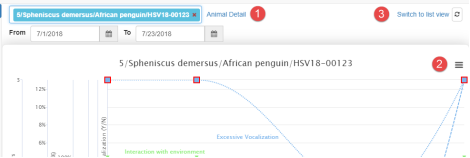
Other options in the Charts are:
1-Selecting Animal Detail will take you directly into the animal record
2-Selecting the hamburger icon allows you to print the Chart
3-Switching to List View will change the view and lay the observations out in rows.
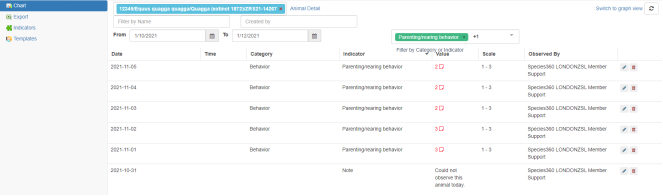
List View shows the data in a list. The columns can be sorted in ascending or descending order. If you want to filter the list to fewer categories, simply uncheck (or press Enter when highlighted) the categories you do not want to see. You can edit or delete your data from this screen.
Editing CAW observations
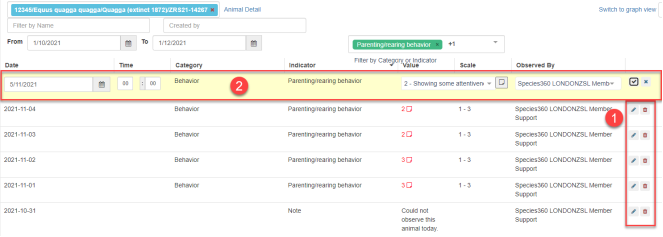
You can only edit or delete observations from the List View in the Chart Function . To edit an observation, click the pen icon next to the observation (1), or choose to delete. The observation you are editing will turn yellow (2), you can edit the Date, Time, Value, Note and Observed By columns. The Category, Indicator and Scale columns cannot be edited, if you made a mistake with these three columns you will need to delete the entry and re-enter in the correct template.
Viewing/Exporting Care and Welfare Notes
Viewing CAW notes in the Chart function
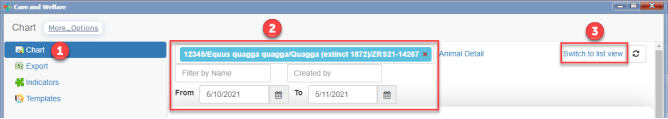
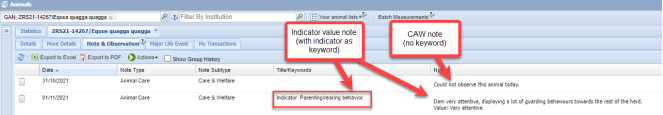
You can view the indicator value note within the chart function in CAW. On the CAW dashboard, click Chart (1), search for your required animal and any other filters (2), and then click Switch to List View (3).
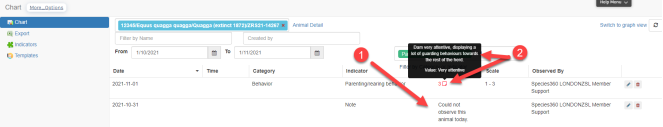
Once in list view, the CAW note appears as a new row (1), with the full note appearing in the value column. The indicator note appears next to the indicator value (2). Hover over the note icon to see the full note.
Viewing CAW notes in Husbandry
If you have turned on the ability to see CAW notes in husbandry , when you add notes in your template and save, ZIMS will add both indicator value notes and CAW notes to each animals Notes & Observations tab. The indicator value notes will have an additional specific keyword relating to the indicator.
Export
Export function
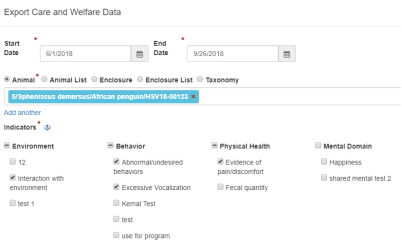
The Export function allows you to export data for an animal. You can export for multiple animals by using Animal Lists, Enclosures or Taxonomy.
Choose your required date range, animal/enclosure and indicators, then click Export to export to Excel.
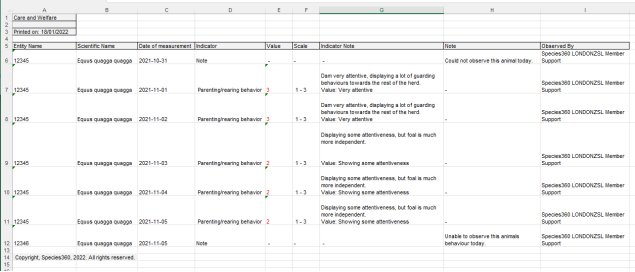
Depending on your indicators and entities, the export will look similar to the below. The export will display the Entity, Species, Date of observation, Indicator, Value, Scale, Indicator Note, CAW Note and who the observation was Observed By.
Exporting outside of the Care and Welfare Module
You can now view your Care and Welfare information outside of the Care and Welfare module. You can see your CAW notes in husbandry , search for CAW notes in the Note Retrieval report , and you can also export your CAW data in the daily and activity report .
Data that has been flagged as “out of range” will display in red on the daily report.
External Sharing
The Care and Welfare module is Local view only for data recorded through Care and Welfare Templates. Your institution has the option to enable the ability for notes added to specific indicators to automatically display in the husbandry module under notes and observations. Note, those with permissions to edit notes/observations can edit the notes from either the husbandry notes/observations tab or from the list view in Care & Welfare.
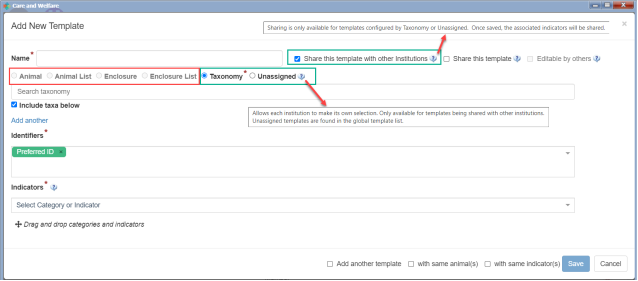
When external sharing is enabled, you will see an option to ‘share template with other institutions’ – this is limited to templates configured to Taxonomy level or Unassigned. It is not possible to share templates with other institutions that are assigned to Animal, Animal List, Enclosure and Enclosure List.
When sharing with other institutions only Local indicators are available, with the exception of three global indicators; Animal Weights, Health Status, and Body Condition Score.
Note, once shared with other institutions, you cannot edit a template anymore.
If you share a husbandry record with another institution, Care and Welfare indicator values will not be shared, but notes added to specific indicators will show in the Notes and Observations husbandry record, and therefore, will be shared externally following standard note sharing rules.
If Weights, Target Weight Range, Body Condition Score and Health Status are recorded through Care and Welfare they will display in the husbandry and medical modules with an icon to show they were recorded in Care and Welfare and follow the same business rules regarding sharing as they do if they were recorded in husbandry or medical. (Weight data, BCS and Health Status are role controlled the same as in husbandry).
In addition to sharing templates, there is the capability to share Locally created Indicators with other institutions. This means, for instance, if you create a Local Indicator for your penguins- you want to monitor how often your penguins walk the entire length of the enclosure without stopping and you think other institutions would find value in monitoring the same behavior, you could share that Indicator. Another institution can then either choose to use the indicator or not. They will never see your data, just the indicator itself that you created and chose to share.
Note, once shared with other institutions, you cannot edit an indicator anymore.
Best Practices
The following are some Best Practices suggestions to get the most out of Care and Welfare:
-
Try to get the involvement of all Staff members who will be using the Care and Welfare module to help plan how it will be used and who will be using it. You only want to configure the Indicators and create the Templates once. The expected usage is:
- Indicators are owned by the welfare officer at your institution
- Templates are used by the animal care staff
- Charts are Curatorial, Veterinary and others with animal collection oversight
-
Whenever possible try to use the Global Indicators
- Care and Welfare information is not currently shared but hopefully it will be in the future
- Using standard Global Indicators will assist with this sharing
-
When creating Local Indicators
- Try to use the default of assigning to All Animals when possible
- Taxonomic exceptions cannot be changed after observations are recorded
- If “specific taxonomic group(s)” is used you cannot go back and select All Animals – you would need to create a new Indicator
- Indicators can be set now and add/edit expected values later
-
When Defining your Scale
- Be consistent in defining the “good” (what you hope to see) and the “bad” (what you don’t want to see) so the Charts are easier to interpret.
- For example, if you select a Numeric Scale for two Indicators but defined a “1” as what you would like to see for one Indicator and defined a “5” as what you would like to see on the other Indicator, it will not be easy to compare trends in the Chart because you want to see a low number for one Indicator and a high number for the other Indicator.
-
Editing an Indicator
- Before data entry all fields can be edited
-
Once data has been recorded for Indicators, the following fields CAN be edited
- Category (warning will be given if associated with records)
- Description (warning will be given if associated with records)
- Explanation
- Value Definition
- Expected Value/Range
-
Once data has been recorded the Indicators, the following fields CANNOT be edited
- Name
- Value Type
- Add/remove Taxonomic Exceptions
- If an Indicator is edited, you should add a batch Note to animals affected that includes what was changed on date “x”
-
Taxonomic Exceptions
- All of the Indicators that have been Configured will display to select from when creating a template regardless of taxonomy selected
- If an Indicator has been used for a taxa, you cannot remove that taxa from the exception
- When actually using the template, if a taxa is not included in the indicator the data entry will be greyed out and a “NA” displayed by default, data cannot be recorded
-
This is an example:
-
Indicator A
- Numeric scale is 1-5
- Taxa exclusion = cheetah
- Numeric scale for cheetah is 1-10
- Data is recorded on cheetah
-
Oops – you really wanted cheetah to be 1-5
- Not going to happen – skews data already recorded
-
Oops – you don’t care about cheetah being an exception
- Not going to happen – skews data already recorded
-
Indicator A
-
Deleting an Indicator
- Care and Welfare data does not go into the animal record, they are retained in the module
- Deleting an Indicator will delete all the observations recorded using it
- You have 3 months to “Roll Back” a deletion using Data Entry Monitor
-
Chart Considerations
-
Weight, Target Weight Range, Health Status and Body Condition Score automatically populate the Charts
- They do not display on List View
- List View allows you to edit the date, time, value and observed by fields
- List View is also where any Notes will display
-
Weight, Target Weight Range, Health Status and Body Condition Score automatically populate the Charts
Editing Rules
Please note these editing rules:
|
|
Action |
Not Yet Used in a Record |
Used in a Record |
|
Template |
|
|
|
|
Edit |
Templates > Edit icon
|
Can be edited. There will be no record entries impacted because the Template was not used. |
Can be edited. All entries recorded using the original Template will remain visible. Going forward, any edits will be displayed in the Template for use. |
|
Delete |
Templates > Delete icon
|
Can be deleted. There will be no record entries to be impacted because the Template was not used. The Template will disappear from the List. |
Can be deleted. All record entries created using the Template will remain available to view. You will receive no warning that the Template has been used in a record. The Template will disappear from the list. |
|
Globally Shared Template |
Templates > Shared with other institutions
|
Can be edited/deleted. |
Cannot be edited/deleted |
|
Global Indicator |
|
|
|
|
Configured an Indicator you do not want used |
Local Admin can Roll Back using Data Entry Monitor if less than 3 months ago. If more than 3 months ago contact Species360 support (usually through your Local Admin. |
Indicator appears in list with "Please Configure". Indicator is not displayed to select in Templates. No records are impacted. |
Indicator appears in list with "Please Configure". Indicator is not displayed to select in Templates. Data is removed from all records in which it was used. |
|
Edit Category |
Templates > Edit icon |
Cannot be edited |
Cannot be edited |
|
Edit Name |
Templates > Edit icon |
Cannot be edited |
Cannot be edited |
|
Edit Description |
Templates > Edit icon |
Cannot be edited |
Cannot be edited |
|
Edit Value Type |
Templates > Edit icon |
Can be edited |
Cannot be edited |
|
Edit Value Explanation |
Templates > Edit icon |
Can be edited |
Can be edited. Explanation impacts no records. |
|
Change Values |
Templates > Edit icon |
Can be edited |
Cannot be edited |
|
Edit Expected Range/Value |
Templates > Edit icon |
Can be edited |
Can be edited. Records entered previously will reflect the current range/value. |
|
Change Taxon Exceptions |
Templates > Edit icon |
Can be edited |
Cannot be edited |
|
|
|
|
|
|
Local Indicator |
|
|
|
|
Created and Configured an Indicator you do not want used |
Delete from Indicator List using the trash can icon |
Indicator is not displayed in the List or to select in Templates. No records impacted as the Template was not used. |
You will receive a warning that the Indicator has been used in records. Indicator is not displayed in the List or to select in Templates. Data is removed from all records in which it was used |
|
Edit Category |
Templates > Edit icon |
Can be edited |
Can be edited |
|
Edit Name |
Templates > Edit icon |
Can be edited |
Cannot be edited |
|
Edit Description |
Templates > Edit icon |
Can be edited |
Can be edited |
|
Edit Value Type |
Templates > Edit icon |
Can be edited |
Cannot be edited |
|
Edit Value Explanation |
Templates > Edit icon |
Can be edited |
Can be edited |
|
Change Values |
Templates > Edit icon |
Can be edited |
Cannot be edited |
|
Edit Expected Range/Value |
Templates > Edit icon |
Can be edited |
Can be edited. Records entered previously will reflect the current range/value. |
|
Change Taxon Exceptions |
Templates > Edit icon |
Can be edited |
Cannot be edited |
|
Edit/delete a Template that is available to other institutions |
Templates > Edit icon |
Cannot be edited or deleted. You will need to ask your Local Admin to roll back the sharing if it has been less than 3 months. If more than 3 months they will need to contact support. |
Cannot be edited or deleted. You will need to ask your Local Admin to roll back the sharing if it has been less than 3 months. If more than 3 months they will need to contact support. |
Webinar series
Access a three-part webinar series all about Care and Welfare
here
. See below for topics.
- Session 1 – Creating Indicators
- Session 2 – Creating Templates
- Session 3 – Entering and Viewing Care and Welfare data
Frequently Asked Questions
How can we share indicators between institutions?
When adding an indicator, you will see an option to: "Make this indicator available to other ZIMS institutions" tickbox. You can also share multiple indicators globally by sharing a whole template.
Can indicators value type be changed for each species template? For example, environmental disturbance as a binary for eagles, but as a numerical scale for wolverines?
You can only set different expected ranges for different species. If you want to set different value types, then you will need to create multiple indicators.
When you choose “0” as a score, how does it record that number if downloading to an Excel spreadsheet? My understanding “0” is not recognized as a "number" by Excel.
The data in that column is exported as text currently, we are aware of this bug. You can convert the values to "number" by highlighting the data in Excel, clicking on the amber ! and then choose "convert to number".
If an indicator is shared from another institution, will you still get the in-use notification if you try to make changes?
You should not get an in-use notification in that example. But you will have limited edit rights and will only be able to set expected values/ranges and taxonomic exceptions for your institution.
If we have already used a few indicators, but now want to completely change things, would it be better to edit them or delete them and completely start over?
If you have already used the indicators, it would be better to create new indicators so that you do not affect any of the previous data. You cannot currently delete indicators, but you can remove templates that use those indicators.
I saw you can export the data to Excel - can you also import data to ZIMS (f.ex. from Excel)?
Unfortunately, at the moment you can only export the data from ZIMS, you cannot import any data into Care and Welfare sorry
One of my assessments is based on a yes, no and unsure/don't know - But I only see a binary yes,no option. Would i have to do a work around with a nominal scale to continue using my yes, no , unsure?
If you configure the indicator using numeric scale, you could do -1, 0, 1 and add the definitions of yes, no and unsure.
If our institution has not previously been using Care and Welfare, are there any specific indicators that you would recommend as possibly the most useful to start incorporating?
All globally available indicators were created by subject matter experts to help others develop welfare templates.
When the % of diet is recorded can this be split into different items for example fruit or veg?
Not in Care and welfare, but you can record a more accurate feed log entry in the feed log section of an animal's record where you can break the diet down by food items.
If the values are out of range, will we be sent an email? or would it be a pop-up box when we log in?
The alerts will not "pop up", but you will find all out-of-range indicators in the alert search. Out of range values will be highlighted in red when graphed or viewed in the chart/list feature. In Daily Activity out of range value with be indicated with an Exclamation mark (!) next to them.
Can you select an enclosure for one line, and add another animal for that template on a second line? Or, does it all have to be by enclosure, or list, or animal?
Yes, you can, after adding your enclosure you can click "add another" and then add your animal.
How do I record information on diet/enrichment/hand rearing…?
You can create indicators to track almost anything for animals in your care. Start by heading to the Indicators tab and creating your own indicators to fit your needs. You choose the category, name, definition and value type of what you want to record, so it can really be tailored to your needs. Once your Indicators are created, add them into a template so you can start recording information on them.
Is there a way to include enclosures below? So that a whole department can be added at the parent enclosure? Or do you need to add all the specific child enclosures?
Currently it does not include enclosures below, for the same reason as not allowing a large taxonomy as the number of animals may be too big. Currently you will need to add each child enclosure. But if this is a feature you would like then please add it to our 'suggest features' site .
If an animal moves to another enclosure. Does the template update this automatically?
If you assign the template by enclosure, each time you load it for data entry, it will show you only the animals currently in the enclosure. So yes, it will update automatically.
If you want to make sure your animal is still in the template if it moves enclosure, then you will want to assign by animal or taxonomy instead.
How does it impact the record if an animal is on an exhibit template but then also has its own template to be able to do assessments more often for an individual?
You can add data to an animal through multiple templates. The data all goes to the same place no matter which template it was added through. So your one animal can have many different templates, and there will be no effect.
If a template is deleted the information stays with the record, but if indicators are changed within a template that messes the data up, correct?
Yes. You can edit and delete templates without affecting the data, but editing and deleting indicators will affect the data.
Can I edit a template after it is globally shared?
No. This is because other institutions may have accepted your template, and we would not want to change theirs.
If the template you shared needs editing, then you can delete it from your templates and create a new one which is more up to date.
You can clone the outdated template and modify it for future use and discontinue using the older format.
Do you have to accept the template to see the indicators associated?
Yes, currently you need to accept the template to see what is in it. We know this is a bit of a flaw in our process and will be working on it when we go through our modernisation process. Presently you can contact the institution named as the indicator's author and ask them for details on the template indicators before accepting as your own.
If you use a template from another institution, can they view all the data you input from your institution? Also, if you reject a shared template later, does that data disappear for good?
You can only see the data entered by your institution in the animal's records. The data does not disappear but the format for entering the data (the template) is no longer available.
If you need or want to change the indicators in a template that you have created locally, is it best to clone and restart? We do not want to mess with the data already stored using the template?
You can remove or add indicators to your template, and you will not lose any data. If you want to continue to run the animal graphing tool by a specific template with the original indicators, then you might want to create a new template (just to save steps of running the graph/export by selecting specific indicators.)
Once you have your template up and running, is it possible to load it up on your tablet and then conduct your observations in an offline mode (for example - in an area of the zoo with no wifi) and save it, or do you need full access to the internet when entering your data?
We recommend configuring indicators and creating templates from a desktop browser. Adding values to a template from a tablet/phone using Google Chrome browser is possible, but not currently supported in an 'offline' mode. You must have wifi.
Could you please remind me how we can get access to LearnZIMS so we can practice using this if we don't currently have permissions.
LearnZIMS is available under the Help Menu while logged into Live ZIMS, See the Academy tab for the Practice with LearnZIMS option.
Also
https://training.species360.org/practice/
(ZIMS account required).
Can the data be viewed on the Animals record?
Notes recorded when entering data into a Care and Welfare template will be transferred to an animals notes and observations tab. To ensure this capability is turned on at your institution, head to Start Menu > Institution > Institution Preferences > Application Settings and ensure the check box next to ‘Display Care & Welfare Notes in Husbandry Record’ is ticked. Then Save and Apply for all users.
Other areas Care and Welfare data can be viewed include:
- The Export tab in Care and Welfare – Export your data to Excel.
- The Chart tab in Care and Welfare – View you Care and Welfare indicators for individual animals as a graph and in a list view.
- Daily Activity – View your Care and Welfare data by taxa, animal, enclosure or animal list for set date ranges. A great way to see an overview of recently added Care and Welfare data.
-
Three specific global indicators (identified by this icon:
 ) created by Species360 transfer data to the corresponding areas on an animals record and medical record. The indicators are:
- Animal Weights
- Body Condition Score
-
Health Status
Revised 5 March 2025