


GRAPH MULTIPLE ANIMALS BY AGE
ZIMS has two graphing options to compare animal weights. The Taxon Profiles allowing you to compare a graph of a single animal’s weight with the weights of other animals in the global database of the same age and sex. The Animal Graphing Tool (a local tool) allows you to view multiple animal weights with the x axis display by the date the weight was recorded. Species360 would like to thank Sjoukje Vaartjes, ZAA Training Convenor and Species360 Adjunct Trainer for sharing her method for graphing multiple local animals by age using the data in ZIMS.
Contact support@Species360.org
The Steps
Step 1: Prepare Your Data
Step 2: Use the Animal Graphing Tool
Step 3: Configure the Data in Excel
Step 4: Create a Graph
The Scenario:
You had three red pandas born at your institution over a period of 17 years. You want to produce a graph that will compare their growth rates over their first year.
Step 1: Prepare your data
- The Unit of Measure must be the same for all animals and throughout the selected Date Range.
- Your date display preferences must be in numbers and not text. For example, 07/15/2006 and not 15 Jul 2006. ZIMS will not export text as numbers and Excel will not recognize the text. You can change this display in My Preferences > Language, Date/Time and Separator Formats.
Step 2: Use the Animal Graphing Tool
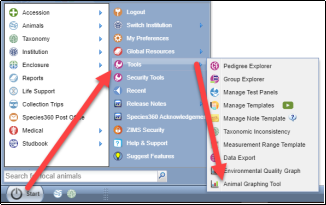
The Animal Graphing Tool is found under Start > Tools > Animal Graphing Tool.
Enter Date Range, Animal IDs and select Animal Weight. In our scenario, the date range would start with the Birth Date for the first red panda (July 9, 2001) and end with the date 1 year after the Birth Date of the last red panda (June 12, 2019).
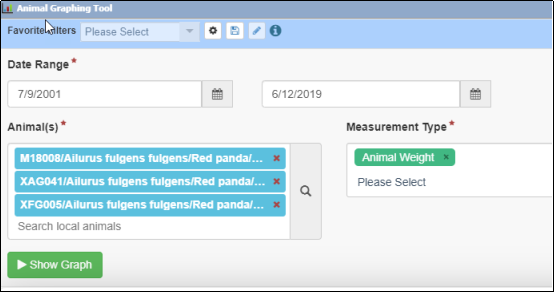
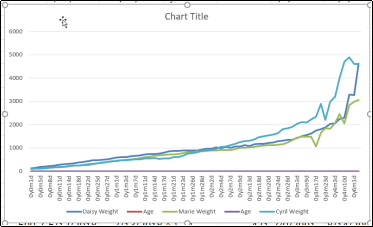
Click on Show Graph.
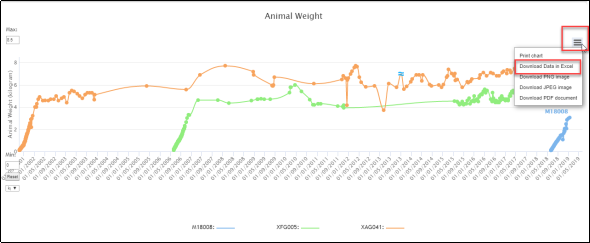
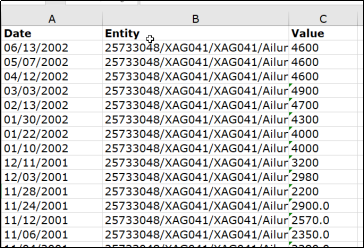
At first glance it looks like they grew at about the same rate, but we can do some data manipulating to get a graph that compares their weights by age for the first year. Select the hamburger icon and choose Download Data in Excel.
Back to The Steps
Step 3: Configure the data in Excel
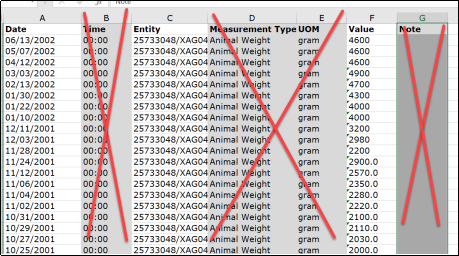
When ZIMS downloads the data from Excel the rows are in order of newest to oldest. To create a graph of oldest to newest you will need to resort the rows by oldest to newest. The easiest time to do that is when you create separate sheets for each animal. Instructions to do this are included at that step.
Enable Editing and remove the columns for Time, Measurement Type, UOM and Notes
Remove any rows for weights recorded on dates that are not desired. For example, our first red panda was born July 9, 2001. We want to compare weights for the first year. We removed any rows for dates after July 9, 2002 for that animal. If more than one weight was recorded on the same day, remove one of them. There can be only one weight per day.
Alternate flow You will eventually need to make each record have the same number of rows. You can do that now to save on the number of times you need to copy something, or follow the recommended flow as detailed in this document.
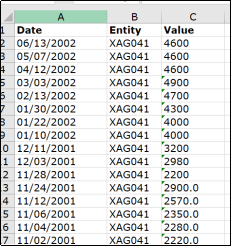
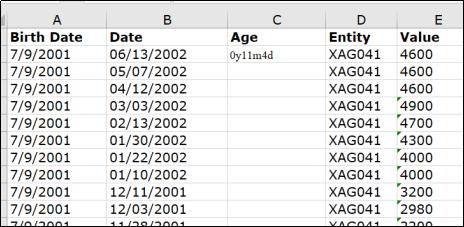
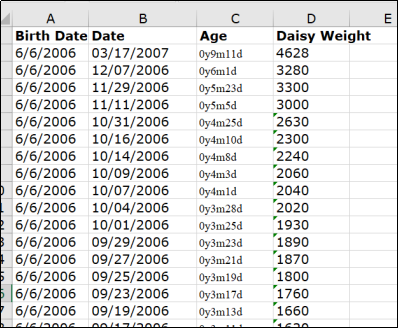
Insert a column to the left of Date and another one after Date. Column A will be Birth Date and column C will be Age.
Record the Birth Date for each animal in column A. This is easily done by copy paste several at a time if the list is long.
In the Age column (C), enter the following formula in the first row:
=DATEDIF(A2,B2,"y") & "y" & DATEDIF(A2,B2,"ym") & "m" & DATEDIF(A2,B2,"md") & "d"
This will convert the date that the weight was taken against the date of birth and return the age of the animal as of that date.
There are two ways to convert the remainder of the Age column. Way 1 is to left click on the cell with the age, grab the lower right hand corner and drag down row by row. The correct age will be calculated for each row.
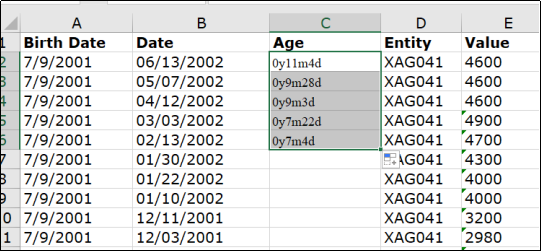
Way 2 is to left click on the cell with the age, hold the shift key and scroll to the bottom of the column highlighting the entire column. Select Fill (upper right) and Down.
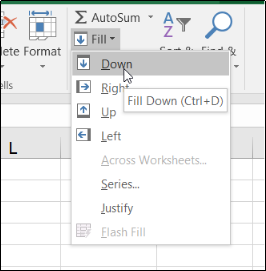
The entire age column will be populated with the correct ages.
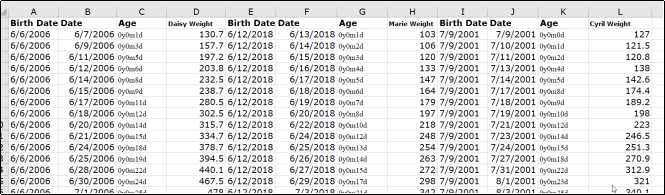
Copy each animal into their own worksheet so that they are separated. You can name each sheet by the identifier that you prefer. It is recommended that you keep the master worksheet with all the animals in case you need to redo one of the single animal worksheets.

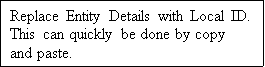
Add a row for column headers if needed. Rename the column headers for the individual animal sheets as needed. What you record for the header in the weight column is what will display in the graph. Delete the Entity column as it is no longer needed. DO NOT delete the Birth Date or the Date column, even though they are not needed for the graph, as the Age column is calculated from them.
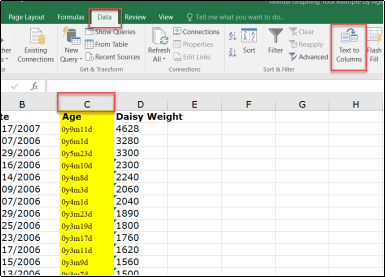
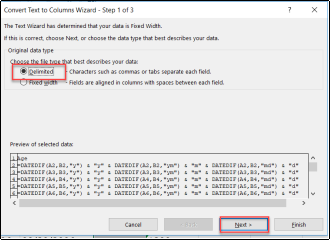
This is a good time to reorder your rows to be oldest to newest if you haven’t already. Select the Age column, select Data from the top menu bar and select Text to Columns.
Choose Delimited and Next, Next, Finish.
Do this for the Date and Weight columns as well and repeat for all animals. This will allow you to sort oldest to newest.
To reorder, select the Date column, select the Data tab and select Sort.
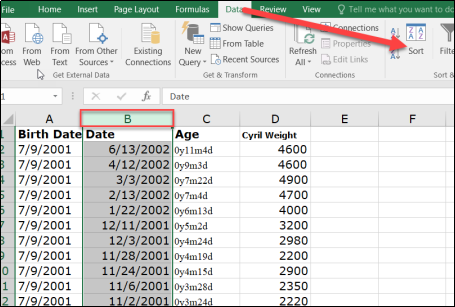
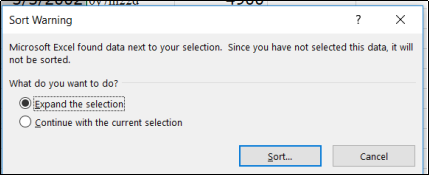
Select Expand the selection and then Sort.
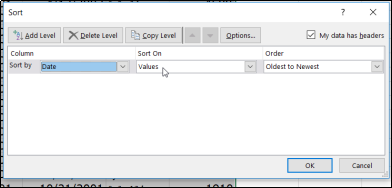
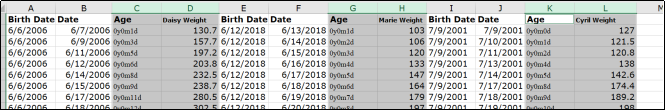
Select to sort by date, order Oldest to Newest and select OK. Your rows should now be displayed with the oldest records on the top.
To create a graph, the number of rows you want to graph for each animal needs to be the same, so you may need to do a bit of deleting to get the number of rows to match. Alternately, you can add a filter to the column headers and select the dates you want.
Alternate Flow
You can do this deleting before you record the Birth Date, change Entity to Local ID or perform the Age calculation to reduce the number of times you have to copy something, but it is recommended to work with the single animal worksheets to do this.
Back to standard flow
Daisy had 109 weights, Marie had 70 weights and Cyril had 116 weights. To make the number of rows match we need to delete 39 rows from Daisy and 46 rows from Cyril. Some recommendations for determining what rows to delete are:
- Don’t delete any rows with weights that don’t appear to be following the progression as they may be an indicator of other issues to consider and you may want that weight displayed.
- If weights were recorded several days in a row and then not until a week later, remove some of the rows for the daily weights.
- If weights remain the same over a period of time, keep the first and last weight and remove the ones in between.
- Otherwise, remove rows at even intervals to maintain the progression.
Copy each animal into a new sheet or copy the other animals into an existing individual sheet. Double check that your number of rows is the same for each animal.
Back to The Steps
Step 4: Create a Graph
Select the Age and Weight columns for the first animal, hold the Ctrl key down and select those columns for the other animal(s).
Select a line chart from the Insert tab.

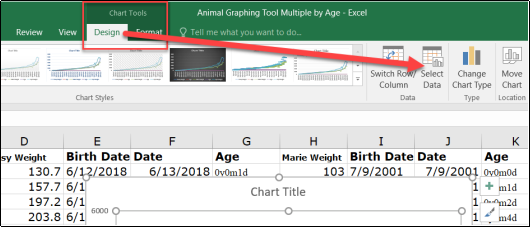
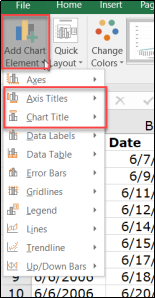
To edit the graph, click on the chart and choose Design > Select Data from the Chart Tools menu.
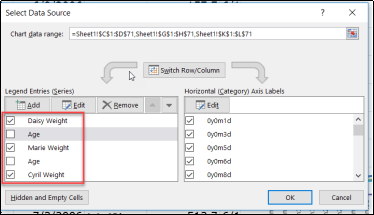
Make sure that only the weight series are checked. Select OK.
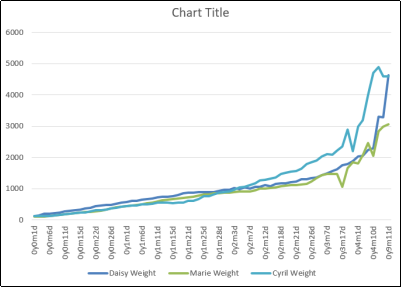
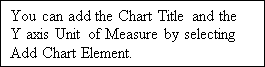
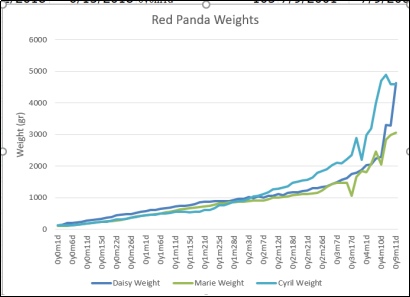
And you are done!!!! The red pandas gained almost the identical weight at the beginning. You can review their records to determine what may have contributed to the differing weight gain towards the end of their first year.
Back to The Steps
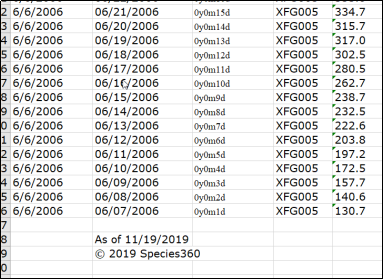
Revised 19 November 2025
It is the mission of Species360 to facilitate international collaboration in the collection and sharing of information on animals and their environments for zoos, aquariums and related organizations.
www.Species360.org – Global Information Serving Conservation